In a recent new study, a detailed analysis of the US airline market-share domination in North America, ranks and lists results by factors such as passenger numbers and miles flown. This particular study focused solely on domestic passengers flying within the US, and depending on how you look at the numbers, the top airline changes over the various categories.
Methodology

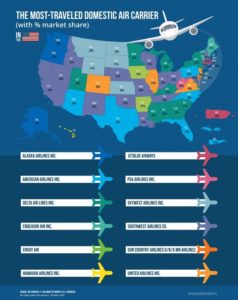
The Most-Traveled Domestic Air Carrier (with % market share)

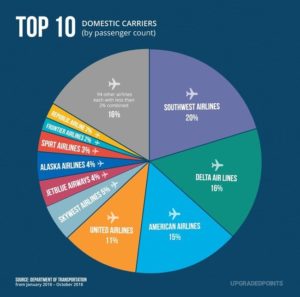
The Top Domestic Carriers by Passenger Count
The Bureau of Transportation Statistics (BTS) maintains current data that sometimes runs on a three-or-four-month delay, depending on when it is compiled and uploaded. This new study conducted by Upgraded Points represents analyzed data from January 2018–October 2018.
The study also uses a specific table from BTS that contains domestic, nonstop segment data reported by air carriers. This includes carrier name, origin, destinations, as well as other information concerning transported passengers. Finally, data from the BTS directly reflects the number of passengers and the distance flown. This particular information was used to create the concluding graphic featured in the study.
Number of Passengers Flown
Looking at the total number of passengers flown during any given time is the clearest indication of market domination. The final results for this time period were surprising: Delta Air Lines and American Airlines were both in the top five carriers, with 16 percent (106,062,211 passengers) and 15 percent (99,857,863 passengers) respectively — but neither ranked as the number one carrier. Each missed that spot by nearly 5 percent. And the clear winner boasted over 132 million passengers.
United Airlines was another major contender for one of the coveted top five spots, sitting at 11 percent of the market share (71,722,425 passengers).
GOT NEWS? click here
Google News, Bing News, Yahoo News, 200+ publications
Most Traveled Air Carrier by State
Geography is a limiting factor when people choose a specific air carrier, especially since further limitations are imposed by air carrier availability at each hub. The Upgraded Points study had to factor in this important detail when ranking its list by state. For example, since Delta Air Lines is based out of Atlanta, it is no surprise that Delta is the dominator of the Georgia market.
But for states like Iowa and Arkansas, the dominating airline is a far less-known carrier. And though American Airlines and Southwest Airlines both flew quite competitively from Texas, one did take the edge over the other in the number of passengers flown from that state.
Most Well-Traveled States
Ranking the states by most well-traveled gives another fascinating look at US air carrier traffic. Researchers expected the most populated states to be the clear winners of the top five spots, simply by virtue of sheer volume. And to a degree, that was true. California, Texas and Florida each flew well over 50 million passengers, securing them the top three spots. But other highly populated states, like New York and Pennsylvania, did not rank in the top five at all.
Those states whose populations travel the least include West Virginia, Wyoming and Delaware. Researchers conceded however that the data might be slightly skewed for these rankings, given that not only does Delaware not have a major airport, it is also one of the least populated states in the US.
Conclusions and Other Rankings
The study concluded by sifting the BTS data into percent of market share by carrier, by month, and revenue passenger miles (RPM). RPM is a particularly important metric that shows the number of miles traveled by paying passengers. At high levels, RPM indicates an airline’s overall traffic. And although there are a variety of large air carriers flying in the US, the final results of the Upgraded Points study clearly indicate that passengers are not evenly split among them.
The full study can be viewed here.


