• Home
  • Post a press-release
  • Visibility packages
  • Subscribe email updates
  • Event Calendar
  • Contact

For Immediate Release | Official News Wire for the Travel Industry

Where press releases are breaking news

  • Home
  • Post a press-release
  • Visibility packages
  • Subscribe email updates
  • Event Calendar
  • Contact

Fraport traffic figures – May 2019: Frankfurt Airport reports solid growth

June 14, 2019 by PressEditor

Frankfurt Airport (FRA) welcomed 6.2 million passengers in May 2019, an increase of 1.4 percent year-on-year. The growth rate would have been one percentage point higher, if FRA had not been affected by a number of weather and strike-related flight cancellations during the reporting month. Over the first five months of 2019, FRA achieved passenger growth of 2.9 percent.

Aircraft movements in May 2019 climbed by 1.0 percent to 46,181 takeoffs and landings. Accumulated maximum takeoff weights (MTOWs) expanded by 0.8 percent to about 2.8 million metric tons. Cargo throughput (airfreight + airmail) slightly grew by 0.6 percent to 185,701 metric tons.

Most of the airports in Fraport AG’s international portfolio also reported passenger growth in May 2019. Slovenia’s Ljubljana Airport (LJU) recorded a 1.8 percent increase in traffic to 170,307 passengers. The two Brazilian airports of Fortaleza (FOR) and Porto Alegre (POA) registered combined traffic of over 1.1 million passengers, also up slightly by 1.1 percent. In Peru, traffic at Lima Airport (LIM) rose by 8.0 percent to 2.0 million passengers.

The 14 Greek regional airports served about 3.1 million passengers overall, slipping by 1.9 percent year-on-year. This slight decline can largely be attributed to the bankruptcy of a few airlines – with other airlines, over the short term, only partially making up for the capacity loss. The busiest airports in Fraport’s Greek portfolio included: Thessaloniki (SKG) with 606,828 passengers, down 0.4 percent; Rhodes (RHO) with 599,993 passengers, down 5.1 percent; and Corfu (CFU) with 347,953 passengers, down 2.0 percent.

After a phase of very strong growth over the past three years, the Bulgarian airports of Varna (VAR) and Burgas (BOJ) are currently experiencing the

June 14, 2019 ANR 18/2019

consolidation of flight offerings, resulting in an 18.3 percent drop in traffic to 270,877 passengers. At the gateway to the Turkish Riviera, Antalya Airport (AYT) received about 3.6 million passengers, a gain of 3.3 percent. Pulkovo Airport (LED) in St. Petersburg, Russia, advanced by 8.4 percent to about 1.7 million passengers. Traffic at Xi’an Airport (XIY) in central China reached almost 4.0 million passengers, up 5.1 percent.

MEDIA CONTACT: Torben Beckmann, Fraport AG, Corporate Communications, Media Relations, 60547 Frankfurt, Germany, E-mail:  t.beckmann@fraport.de , Facebook:  www.facebook.com/FrankfurtAirport

Share this:

  • Twitter
  • Facebook

Filed Under: Travel & Tourism Tagged With: fra, Fraport, media relations, passengers, percentage, traffic

Hawaii hotels: Flat average daily rate, lower occupancy so far in 2019

April 24, 2019 by Forimmediaterelease

For the first three months of 2019, Hawaii hotels statewide reported flat average daily rate (ADR) and lower occupancy, which resulted in lower revenue per available room (RevPAR) compared to the first quarter of 2018.

According to the Hawaii Hotel Performance Report published by the Hawaii Tourism Authority (HTA), statewide RevPAR declined to $236 (-3.3%), with ADR of $292 and occupancy of 80.8 percent (-2.7 percentage points) in the first quarter of 2019.

HTA’s Tourism Research Division issued the report’s findings utilizing data compiled by STR, Inc., which conducts the largest and most comprehensive survey of hotel properties in the Hawaiian Islands.

For the first quarter, Hawaii hotel room revenues fell by 4.7 percent to $1.13 billion compared to the $1.18 billion earned in the first quarter of 2018. There were more than 74,300 fewer available room nights (-1.5%) in the first quarter and approximately 190,500 fewer occupied room nights (-4.7%) compared to a year ago. Several hotel properties across the state were closed for renovation or had rooms out of service for renovation during the first quarter.

All classes of Hawaii hotel properties statewide reported RevPAR declines in the first quarter of 2019 except Upper Midscale Class properties ($134, +0.6%). Luxury Class properties reported RevPAR of $452 (-5.4%) with ADR of $594 (-1.2%) and occupancy of 76.1 percent (-3.3 percentage points). At the other end of the price scale, Midscale & Economy Class hotels reported RevPAR of $155 (-5.0%) with ADR of $187 (-0.5%) and occupancy of 83.1 percent (-3.9 percentage points).

Comparison to Top U.S. Markets

In comparison to top U.S. markets, the Hawaiian Islands earned the highest RevPAR at $236 in the first quarter, followed by the San Francisco/San Mateo market at $210 (+15.9%) and the Miami/Hialeah market at $208 (-3.5%). Hawaii also led the U.S. markets in ADR at $292 followed by San Francisco/San Mateo and Miami/Hialeah. The Hawaiian Islands ranked fifth for occupancy at 80.8 percent, with Miami/Hialeah topping the list at 83.0 percent (-2.1 percentage points).

Hotel Results for Hawaii’s Four Counties

Hotel properties in Hawaii’s four island counties all reported RevPAR decreases in the first quarter of 2019. Maui County hotels led the state overall in RevPAR at $337 (-2.7%), with ADR at $428 (-0.9%) and occupancy at 78.6 percent (-1.5 percentage points).

Kauai hotels earned RevPAR of $228 (-10.2%), with flat ADR at $305 (+0.2%) and lower occupancy of 74.8 percent (-8.7 percentage points).

Hotels on the island of Hawaii reported a decline in RevPAR to $225 (-9.7%), due to a combination of decreases in both ADR ($285, -2.0%) and occupancy (79.1%, -6.7 percentage points).

Oahu hotels earned slightly lower RevPAR at $196 (-0.9%), with ADR at $236 (+0.8%) and occupancy of 83.0 percent (-1.4 percentage points).

Comparison to International Markets

When compared to international “sun and sea” destinations, Hawaii’s counties were in the middle of the pack for RevPAR in the first quarter of 2019. Hotels in the Maldives ranked highest in RevPAR at $575 (+4.5%) followed by Aruba at $351 (+11.2%). Maui County ranked third, with Kauai, the island of Hawaii, and Oahu ranking sixth, seventh and eighth, respectively.

The Maldives also led in ADR at $737 (+5.2%) in the first quarter, followed by French Polynesia at $497 (-1.1%). Maui County ranked fifth, followed by Kauai and the island of Hawaii. Oahu ranked ninth .

Oahu trailed Phuket (84.5%, -6.3 percentage points) in occupancy for sun and sea destinations in the first quarter. The island of Hawaii, Maui County and Kauai ranked fourth, fifth and ninth, respectively.

March 2019 Hotel Performance

In March 2019, RevPAR for Hawaii hotels statewide declined to $227 (-4.3%), with ADR of $285 (-1.1%) and occupancy of 79.6 percent (-2.7 percentage points).

In March, Hawaii hotel room revenues fell by 5.9 percent to $373.3 million. There were more than 27,200 fewer available room nights (-1.6%) in March and approximately 66,850 fewer occupied room nights (-4.9%) compared to a year ago. Several hotel properties across the state were closed for renovation or had rooms out of service for renovation during March. However, the number of rooms out of service may be under-reported.

All classes of Hawaii hotel properties statewide reported RevPAR declines in March. Luxury Class properties reported RevPAR of $443 (-7.2%) with ADR of $583 (-3.1%) and occupancy of 75.9 percent (-3.4 percentage points). Midscale & Economy Class hotels reported RevPAR of $150 (-2.9%) with ADR of $182 (+0.8%) and occupancy of 82.0 percent (-3.1 percentage points).

Hotel properties in Hawaii’s four island counties all reported lower RevPAR for March. Maui County hotels reported the highest RevPAR in March at $336 (-1.4%) with ADR of $421 (-1.6%) and flat occupancy (79.8%, +0.2 percentage points).

Oahu hotels reported lower occupancy (80.4%, -2.3 percentage points) and flat ADR ($230, -0.2%) for March.

Hotels on the island of Hawaii continued to face challenges in March, with RevPAR dropping 11.2 percent to $216, ADR to $272 (-4.9%) and occupancy to 79.2 percent (-5.7 percentage points).

RevPAR for Kauai hotels fell to $213 (-14.6%) in March, with declines in both ADR to $286 (-4.5%) and occupancy to 74.4 percent (-8.8 percentage points).

Travel News | eTurboNews

Share this:

  • Twitter
  • Facebook

Filed Under: Press Release Tagged With: American Travel News, and, Aruba, authority, average, billion, Breaking Travel News, challenges, class, Class hotels, classes, closed, compared, continued, Corporate News, County, daily, Data, decline, declined, declines, Destinations, Division, due, Economy, economy class, end, face, far, Feature, fewer, findings, first, first quarter, flat, followed, Francisco, free, French, French Polynesia, Hawaii, Hawaii Hotel Performance Report, Hawaii tourism, Hawaii Tourism Authority, Hawaii Travel News, Hawaiian, hawaiian islands, highest, Hospitality News, hotel, hotel room, Hotel Travel News, Hotels, HTA, in, Inc, International, international markets, island, islands, issued, Kauai, largest, LED, list, lower, Luxury, Luxury Travel News, maldives, march, Market, markets, Maui, May, Miami, Middle, million, months, most, News articles, nights, number, Oahu, occupancy, out, pack, percent, percentage, performance, Phuket, points, Polynesia, price, properties, published, quarter, ranked, ranking, rate, renovation, report, reported, research, Resort News, resulted, results, Revenue, revenue per available room, revenues, REVPar, room, room nights, rooms, s, San Francisco, scale, sea, service, Slightly, State, STR, Sun, survey, The Island, to, top, tourism, tourism authority, tourism research, Travel & Tourism Organizations News, Travel Destination News, Travelwire News, were, year

Solomon Islands dive operators to establish formal association

April 18, 2019 by Forimmediaterelease

A major step forward for the future promotion and development of the Solomon Islands dive tourism sector, the destination’s main dive operators have agreed to combine resources to create a formal representative body – Dive Operators Solomon Islands (DOSI).

The move follows a recent forum in Honiara facilitated by Strongim Bisnis, an Australian government initiative working in partnership with local companies and operators to promote business growth.

All participants unanimously agreed on the need for a formal association to champion issues affecting the local dive industry in relation to the overall growth of the tourism industry.

Forum attendees included Tulagi Dive, Raiders Hotel & Dive, Driftwood Solomon Islands, Biliki Cruises, Dive Munda/Solomon Islands Dive Expeditions, Yawana Dive, Dive Gizo and Uepi Island Resort

Gizo-based Sanbis Resort and Solomon Dive Adventures are also expected to become DOSI members.

Other stakeholders taking part included the Ministry of Culture & Tourism, Tourism Solomons, Solomon Airlines, and the Solomon Islands Chamber of Commerce & Industry.

Representatives from the Australian Department of Foreign Affairs & Trade and NZAid also attended.

Welcoming the development, Tourism CEO, Josefa ‘Jo’ Tuamoto underlined the important role a strong, united dive operators’ association can play in helping to shape the country’s tourism future.

“This has certainly been the case in several of our neighbouring destinations where dive operators have combined resources to form industry bodies and in the process taken action in helping to propel increased international visitation numbers,” Mr Tuamoto said.

“From our perspective, tourism is ever growing in importance as a key economical driver for the Solomon Islands and with international divers making up a large percentage of the 28,000 international visitors we host every year, we need to do all possible to ensure we maximise the opportunity.

“Having a strong, uniform voice with the ability to help raise and tackle pertinent issues affecting this key sector is timely.

“This voice in synch with stakeholders will enable us jointly to drive what has the potential to act as a very powerful industry lobby.”

The Solomon Islands is renowned as one of the world’s foremost dive locations.

Just last December the Solomons Islands was named one of the world’s top 10 dive destination’s in the prestigious annual ‘Dive Travel Awards’ conducted by the world’s largest dive publication, British-based Dive Magazine UK.

In 2017 CNN Travel ranked the Solomon Islands as one of its 10 best snorkelling locations.

The destination’s 992 islands and unspoilt coral reefs literally teem with huge numbers and unique varieties of marine life.

Add to this the dozens of WWII shipwrecks and downed aircraft that litter the seabed, so much so that in one area just a short journey from the country’s capital Honiara has been renamed ‘Iron Bottom Sound’.

Travel News | eTurboNews

Share this:

  • Twitter
  • Facebook

Filed Under: Press Release Tagged With: and, annual, area, association, attendees, Australian, Australian Department of Foreign Affairs & Trade, Australian government, Awards, based, best, bodies, body, Breaking Travel News, British, Business, business growth, capital, case, CEO, chamber, chamber of commerce, champion, CNN, combine, commerce, companies, coral, coral reefs, country, create, cruises, culture, December, department, Destination, Destinations, development, dive, dive operators, divers, DOSI, downed, drive, driver, establish, expected, expeditions, foreign, Foreign Affairs, form, forum, Forward, free, future, government, Growing, Growth, help, Helping, Honiara, host, hotel, importance, important, in, included, increased, Industry, initiative, International, International Travel News, international visitors, island, islands, issues, journey, just, key, largest, last, life, lobby, local, locations, magazine, Main, major, marine, marine life, members, ministry, move, Mr, named, need, News articles, numbers, operators, opportunity, participants, partnership, percentage, play, potential, Powerful, prestigious, promote, promotion, publication, raise, ranked, recent, renamed, representative, resort, resources, role, s, said, sector, short, Solomon Airlines, Solomon Islands, Solomon Islands travel news, Solomons, Solomons Islands, sound, stakeholders, strong, taking, The Ministry, The World, to, TO DO, top, top 10, tourism, tourism CEO, tourism future, Tourism Industry, tourism sector, Tourism Solomons, Trade, Travel, Travel & Tourism Organizations News, travel awards, Travel Destination News, Travelwire News, UK, uniform, unique, United, up, US, visitation, visitors, voice, We, welcoming, working, World, World News, WWII, year

Brexit has not deterred business travelers in the UK

April 17, 2019 by Forimmediaterelease

UK’s 2018 Hotels Market Report shows that the UK regional capitals are performing strongly with overall room nights booked growing by 8% across the top 250 UK cities.

London continues to be business travelers’ favorite capital for work trips with 663,000 room nights booked in 2018, an increase of 5% when compared to 2017. But Edinburgh experienced the highest level of growth in 2018 with room nights booked increasing by 16%, Belfast was up 13% and Cardiff up 5%.

The 2018 Hotels Market Report analyses data from corporate hotel bookings made between January and December 2018 by Advantage’s TMC members, who represent around 40% of the UK business travel sector, highlighting business travel trends and booking behaviour.

The report also shows significant growth for cities in the Midlands and North East, with Derby seeing the highest growth with 31% more booked room nights compared to 2017, while York, Nottingham and Gateshead also saw double-digit percentage increases.

Top Ten UK Cities – Booked Room Night Percentage Increase (year-on-year), January – December 2018

1. Derby – 31%
2. York – 22%
3. Plymouth – 21%
4. Inverness – 20%
5. Nottingham – 18%
6. Edinburgh – 16%
7. Reading – 15%
8. Belfast – 13%
9. Norwich – 11%
10. Gateshead – 10%

Global Results

The business world continues to travel widely, with the 2018 Hotels Report recording that hotel demand remains strong in many international cities with New York, Auckland, Wellington, Houston, Paris and Sydney topping the Advantage Top Cities list. In total, worldwide volume grew by over 393,000 room nights, a total increase of 8.74% compared to 2017, indicating that SME (Small and Medium Enterprise) corporate accounts, in which Advantage TMCs specialise, continue to perform strongly.

The total number of bookings made by Advantage business travel members in 2018 saw similar growth – up 8.76% – while the average length of stay remained constant, at 1.87 nights. Increased demand and higher occupancy globally meant hotel rates have increased by US$2 to an average daily rate (ADR) of US$169.41.

The report also looks at trends on bookings and ADR for cities and locations around the world, with New York once again topping the list as the highest volume worldwide city outside the UK, with 90,799 room nights booked at an average rate of US$395.97 per night. Increases were also seen in Bangalore (up 54%), Kuala Lumpur (up 36%) and Boston (up 27%).

The corporate hotel sector continues to grow, with another significant increase in bookings year-on-year, made by independent TMCs. Despite continued uncertainty in both the global and UK economies including Brexit, hotel room night demand is at record levels in many destinations. Although not all destinations in Britain saw an increase in room nights booked, ADR remained strong.

The report is representative of hotel bookings made across most of the major international and independent hotel groups including: Accor, Apex Hotels, Choice Hotels, Citadines, Clayton Hotels, Design Hotels, The Doyle Collection, Edwardian Hotels, glh Hotels, Hallmark Hotels, Hilton, HotelREZ, Hyatt, House of Daniel Thwaites, IHG, Jurys Inn & Leonardo Hotels, Loews Hotels, Macdonald Hotels, Maldron Hotels, Melia Hotels International, Millennium Hotels & Resorts, The Montcalm Hotels, NH Hotels, O’Callaghan Collection, Omni, Park Plaza, Pegasus, QHotels, Quest, Rotana, Radisson Hotel Group, Sabre Hospitality, Small Luxury Hotels, TravelClick, Travelodge, Village Hotels Club, WorldHotels Collection and Wyndham Hotel Group.

Travel News | eTurboNews

Share this:

  • Twitter
  • Facebook

Filed Under: Press Release Tagged With: and, apex, around the world, Auckland, average, Bangalore, Belfast, booked, Booking, bookings, Boston, Breaking Travel News, Brexit, Britain, Business, Business Travel, business travelers, capital, capitals, choice, Choice Hotels, cities, city, club, collection, compared, continue, continued, continues, corporate, daily, Daniel, Data, December, demand, design, Design Hotels, Destinations, double, East, economies, Edinburgh, enterprise, experienced, favorite, free, Global, global results, globally, Group, groups, grow, Growing, Growth, higher, highest, Hilton, hospitality, Hospitality News, hotel, hotel bookings, Hotel Group, hotel rates, hotel room, Hotel Travel News, Hotels, Hotels International, Hotels Market Report, house, Houston, Hyatt, IHG, in, including, increase, increased, increases, increasing, independent, inn, International, International Travel News, Inverness, January, Kuala Lumpur, length of stay, list, locations, London, Lumpur, Luxury, luxury hotels, Macdonald, major, Market, Market Report, Medium, melia hotels, members, MICE Industry News, Millennium, most, New, new york, News articles, NH, NH Hotels, night, nights, North, Nottingham, number, occupancy, outside, over, Paris, park, Park Plaza, Pegasus, percentage, perform, performing, quest, Radisson, Radisson Hotel Group, rate, rates, reading, record, record levels, regional, remained, remains, report, represent, representative, Resort News, resorts, results, room, room nights, Rotana, s, Sabre, sector, seeing, shows, significant, significant growth, small, SME, stay, strong, Sydney, The World, TMC, to, TO BE, top, top cities, top ten, total, tourism, Travel, Travel & Tourism Organizations News, Travel Destination News, travel sector, travel trends, travelers, TraveLodge, Travelwire News, Trends, trips, UK, UK business, UK Travel News, uncertainty, up, US, village, were, WHO, work, World, Worldhotels, worldwide, Wyndham, Wyndham Hotel Group, year, York

Keeping Alitalia airline afloat: 900 million euro bridge loan conversion

April 11, 2019 by Forimmediaterelease

Italy’s last council of ministers have approved a new decree law with 11 new rules presented by the Minister of Economic Development, Luigi Di Maio. Among these, at the last minute, is the regulation allowing for the conversion of part of a bridge loan – 900 million euros granted to Alitalia airline in May 2017 – into equity, and, therefore, into a share package (about 15%) of the new company that will be presented by Italia Railways (FS).

In short, the go-ahead for the Treasury to become a shareholder of the new Alitalia in a scheme is official, but all has yet to be defined. At the same time, in fact, an okay was given to the extension of another month (from March 31 to April 30) to FS for the presentation of an industrial plan to the extraordinary commissioners.

The company led by Gianfranco Battisti would have preferred a longer margin that would also cover the month of May, in order to have more time to contract the entry of the other partners.

Between the Ministry of Economy and Finance (15%), FS (30-40%), and Delta (10%), a large percentage is still uncovered which has not yet met stakeholders’ approval.

With CDP, (a loan banc) Poste (the Mail Group) and Fincantieri, which have repeatedly confirmed their lack of interest in the operation, the tracks leading to China Eastern and Atlantia (Autostrade concessionaire and reference shareholder of Aeroporti di Roma) would still be alive.

Travel News | eTurboNews

Share this:

  • Twitter
  • Facebook

Filed Under: Press Release Tagged With: and, approval, approved, April, Aviation News, aviation-website, Battisti, Breaking Travel News, bridge, China, China Eastern, commissioners, company, confirmed, contract, council, council of ministers, cover-up, Delta, development, Di Maio, Eastern, economic, economic development, Economy, entry, equity, Euro, euros, extension, Extraordinary, Feature, Finance, Fincantieri, FS, GO!, Group, in, industrial, interest, Italia, Italy, Italy travel news, lack, last, law, leading, LED, Loan, Luigi Di Maio, mail, march, May, met, million, minister, ministers, ministry, month, more time, New, new Alitalia, new rules, News articles, official, operation, order, package, partners, percentage, plan, Preferred, presentation, railways, regulation, rules, s, scheme, Share, shareholder, short, stakeholders, The Minister, The Ministry, The Treasury, time, to, TO BE, Transportation News, Travelwire News

IATA Report: Aviation continues to deliver solid

April 4, 2019 by Forimmediaterelease

The International Air Transport Association (IATA) announced global passenger traffic results for February 2019 showing total revenue passenger kilometers (RPKs) rose 5.3%, compared to February 2018. This was the slowest rate of growth in more than a year but still in line with long-term demand trends. Monthly capacity (available seat kilometers or ASKs) increased by 5.4%, and load factor slipped 0.1 percentage point to 80.6%, which is still high by historic standards.

“After January’s strong performance, we settled down a bit in February, in line with concerns about the broader economic outlook. Continuing trade tensions between the US and China, and unresolved uncertainty over Brexit are also weighing on the outlook for travel,” said Alexandre de Juniac, IATA’s Director General and CEO.

February 2019
(% year-on-year)
World share1 RPK ASK PLF
(%-pt)2
PLF
(level)3
Total Market 100.0% 5.3% 5.4% -0.1% 80.6%
Africa 2.1% 2.8% 1.1% 1.1% 70.4%
Asia Pacific 34.5% 6.3% 5.8% 0.4% 82.6%
Europe 26.7% 7.3% 7.7% -0.3% 81.5%
Latin America 5.1% 5.0% 5.5% -0.4% 81.3%
Middle East 9.2% -0.9% 2.7% -2.6% 72.6%
North America 22.4% 4.2% 3.9% 0.3% 80.8%


nternational Passenger Markets

February international passenger demand rose 4.6% compared to February 2018, which was a slowdown from 5.9% growth in January. Capacity climbed 5.1%, and load factor dropped 0.4 percentage point to 79.5%. Airlines in all regions but the Middle East showed traffic growth versus the year-ago period.

  • European carriers showed the strongest performance for a fifth consecutive month in February. Passenger demand increased by 7.6%, compared to a year ago, unchanged from January. Europe’s continuing strong performance provides a paradox given Brexit concerns and signs of a softer economic outlook. Capacity rose 8.0% and load factor slid 0.3 percentage point to 82.3%, which still was the highest among regions.
  • Asia-Pacific airlines’ February traffic rose 4.2% compared to the year-ago period, a substantial slowdown from the 7.2% increase recorded in January. The timing of the Lunar New Year holiday in the first week of February this year may have shifted some traffic to January. Capacity increased 4.7% and load factor dipped 0.3 percentage point to 81.0%.
  • Middle East carriers recorded a 0.8% traffic decline in February compared to a year ago, the only region to report a drop year-over-year. Capacity rose 2.9% and load factor fell 2.7 percentage points to 72.6%. Broadly speaking, passenger volumes of the region’s airlines have been moving sideways for the past 12 – 15 months.
  • North American airlines’ traffic climbed 4.2% in February, a decline from 5.4% growth in January. Capacity rose 2.9% and load factor was up 1.0 percentage point to 79.0%. Signs of softening economic activity at the end of 2018, in conjunction with the effects of ongoing tensions between the US and several of its trading partners, may be mitigated by the region’s low unemployment and generally sound economic backdrop.
  • Latin American airlines saw traffic rise 4.3% compared to February 2018, a slippage from 5.4% annual growth in January. Capacity increased by 5.6%, and load factor dropped 1.0 percentage point to 81.4%. Renewed economic and political uncertainties in a number of key countries may weigh upon air transport demand in coming months.
  • African airlines experienced a 2.5% rise in traffic for the month compared to the year-ago period, down from 5.1% growth in January. Concerns over conditions in the largest economies are contributing to the slowdown. Capacity rose 0.3%, and load factor climbed 1.5 percentage points to 69.7%.

Domestic Passenger Markets

Domestic travel demand rose 6.4% in February compared to February 2018, down from 7.4% annual growth in January. All markets except Australia reported increases in traffic, with India recording its 54th consecutive month of double-digit percentage growth. Domestic capacity climbed 5.8%, and load factor edged up 0.5 percentage point to 82.4%.

February 2019
(% year-on-year)
World share1 RPK ASK PLF
(%-pt)2
PLF
(level)3
Domestic 36.1% 6.4% 5.8% 0.5% 82.4%
Australia 0.9% -1.7% -1.6% -0.1% 78.0%
Brazil 1.1% 5.8% 3.1% 2.1% 82.5%
China P.R 9.5% 11.4% 8.9% 1.9% 86.9%
India 1.6% 10.0% 12.3% -1.9% 89.1%
Japan 1.0% 2.5% 2.9% -0.2% 70.9%
Russian Fed. 1.4% 10.1% 11.8% -1.1% 76.9%
US 14.1% 4.5% 4.8% -0.2% 81.7%


  • China topped the growth chart for a second month in a row, with RPKs up a strong 11.4% year-on-year, although this was down from 14.5% growth in January compared to a year ago.
  • Brazil’s domestic traffic increased 5.8% in February, compared to a year ago, the fastest pace in more than six months and more than double the 2.6% year-over-year rise for January. Brazil was the only domestic market tracked by IATA to show an increase in the year-on-year growth rate compared to January 2019.

The Bottom Line

“While overall economic confidence appears to be softening, aviation continues to deliver solid results, helping to sustain global commerce and the movement of people. The Brexit deadline has come and gone with no separation agreement, but with vital air connectivity between the UK and the Continent maintained for the present. Temporary measures, however, are no substitute for a comprehensive Brexit package that will ensure that the Business of Freedom is able to play its vital role in contributing to the well-being of the region—and the world,” said de Juniac.

Read the full February Passenger Traffic Analysis  (pdf)

Travel News | eTurboNews

Share this:

  • Twitter
  • Facebook

Filed Under: Press Release Tagged With: and, announced, annual, Asia, Asia Pacific, association, Australia, aviation, Aviation News, aviation-website, backdrop, Bit, bottom line, Brazil, Breaking Travel News, Brexit, Business, capacity, carriers, CEO, China, come, coming, commerce, compared, concerns, conditions, confidence, connectivity, continent, continues, contributing, Corporate News, countries, deadline, decline, deliver, demand, demand rose, director, director general, domestic, domestic capacity, domestic market, domestic travel, double, down, drop, East, economic, economic outlook, economies, effects, end, Europe, European, European carriers, experienced, factor, first, freedom, full, general, Global, global passenger traffic, Growth, Growth Rate, Helping, high, highest, historic, holiday, IATA, in, In February, increase, increased, increases, India, International, International Air Transport Association, January, japan, Juniac, kilometers, largest, largest economies, Latin, Latin America, Latin American, line, load, load factor, low, lunar new year, Lunar New Year Holiday, Market, markets, May, measures, Middle, Middle East, month, months, movement, moving, nbsp, New, new year, News articles, North, North America, North American, North American airlines, number, ongoing, only, outlook, over, P.R, Pacific, package, partners, passenger, passenger demand, passenger markets, passenger traffic, past, People, percentage, performance, period, play, points, political, present, provides, pt, rate, recorded, region, regions, report, reported, results, Revenue, rise, role, rose, row, Russian, s, said, seat, second, separation, settled, show, Sideways, signs, slowdown, sound, standards, strong, strong performance, sustain, temporary, tensions, term, The International Air Transport Association, The Region, The World, timing, to, TO BE, total, tourism, Trade, trading, traffic, traffic growth, traffic results, traffic rose, transport, Transportation News, Travel, Travel & Tourism Organizations News, travel demand, Travel Destination News, Travel Technology News, Travelwire News, Trends, UK, UK Travel News, uncertainty, unchanged, unemployment, up, US, Vital, volumes, We, week, World, year

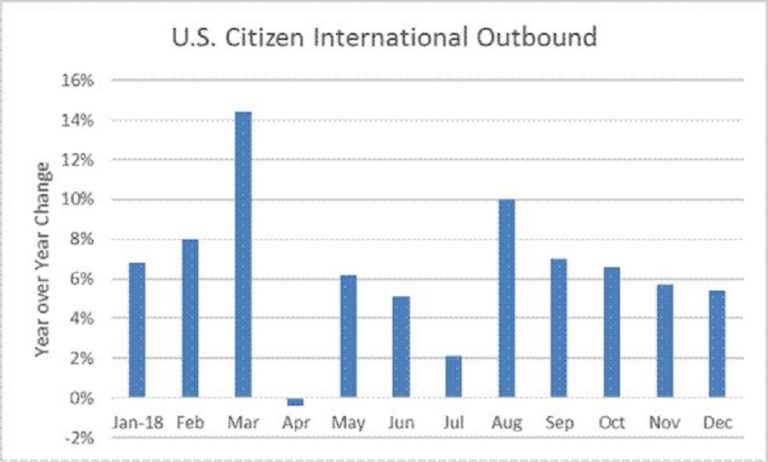
US citizen international departures up 6% in 2018

April 4, 2019 by Forimmediaterelease

U.S. air travel to overseas markets totaled 41.8 million, up nine percent for the year. Regional results were:

  • Europe, 17.7 million travelers, up 12 percent
  • Caribbean, 8.3 million travelers, up five percent
  • Asia, 6.3 million travelers, up eight percent
  • Central America, 3.2 million travelers, up seven percent
  • Middle East, 2.4 million travelers, up six percent
  • South America, 2.1 million travelers, up nine percent
  • Oceania, 861,000 travelers, up 11 percent
  • Africa, 432,000 travelers, up seven percent

U.S. travel to North American markets totaled 51.3 million, up four percent compared to 2017.

  • To Mexico, U.S. travelers totaled a record 36.9 million, up six percent
  • ‘Tourist’ (longer haul travel) 19.1 million, up four percent.
  • U.S. air travel to Mexico (10.1 million), part of ‘Tourist’, was up three percent
  • Border (1+ nights travel) 17.8 million, increased eight percent.
  • To Canada, 14.3 million U.S. travelers, ‘flat’ year-over-year. Air travel (4.6 million) was down four percent

Annual 2018 Market Shares

U.S. air travel to overseas locations accounted for 45 percent of total U.S. outbound travel, up one percentage point from 2017. Regional composition:

    • Europe, a 19 percent share (up one percentage point from 2017);
    • Caribbean, a nine percent share; (down one percentage point from 2017)
    • Asia, a seven percent share;
    • Central America, a four percent share;
    • Middle East, a three percent share;
    • South America, a two percent share);
    • Oceania, a one percent share, and
    • Africa, almost a one percent share

North American markets received 55 percent of all U.S. international outbound travel.

    • U.S. travel to Mexico a 40 percent share;
    • To Canada, a 15 percent share (down one percentage point from 2017).

For detailed information and data tables please click here.

Canada and Mexico numbers are preliminary. The chart will reflect final changes.

In 2011, NTTO (then OTTI) began to report U.S. outbound travel monthly by all modes, expanding beyond air-only traffic. Total travel, inclusive of all modes, to Canada and Mexico is reported in addition to the air-only subtotals. The timing of this report is dependent data from the U.S. Department of Homeland Security, Stats Canada and Banco de Mexico (INEGI), respectively.

Travel News | eTurboNews

Share this:

  • Twitter
  • Facebook

Filed Under: Press Release Tagged With: and, annual, Asia, Aviation News, border, Breaking Travel News, Canada, Caribbean, Central, Central America, changes, citizen, Click, compared, Data, department, Department of Homeland Security, departures, down, East, eight, Europe, expanding, flat, Homeland Security, in, inclusive, increased, information, International, international departures, International Travel News, locations, Market, markets, Mexico, Middle, Middle East, million, million travelers, million U.S., News articles, nights, North, North American, numbers, only, outbound, outbound travel, over, overseas, percent, percentage, received, record, regional, report, reported, results, s, Security, seven, Share, shares, South, South America, timing, to, total, tourist, traffic, Transportation News, Travel, Travel & Tourism Organizations News, Travel Destination News, travelers, Travelwire News, U.S, U.S. travel, U.S. travelers, up, US, US citizen, were, year

Destinations need new resources to tackle the “invisible burden” of tourism

March 25, 2019 by Forimmediaterelease

A report published today by the Travel Foundation, Cornell University’s Centre for Sustainable Global Enterprise and EplerWood International describes how destinations must uncover and account for tourism’s hidden costs, referred to as the “invisible burden,” to protect and manage vital destination assets worldwide. Failing to do so puts ecosystems, cultural wonders, and community life at increasing risk, and places the tourism industry on a weak foundation that could crack under its own weight.

The range of costs not currently accounted for include those needed to:

  • upgrade infrastructure beyond resident needs, to meet tourism demand;
  • manage and protect public spaces, monuments, the environment and natural habitats;
  • mitigate exposure to climate change risks; and
  • address the needs of locals affected by rising real estate prices, driven by the demand from tourism.

Either residents are left to pay these costs, or they are simply not paid, increasingly leading to environmental crises, spoiled tourism assets, and growing dissatisfaction among local residents. Destination authorities urgently need access to new resources, systems and expertise to ensure that, as tourism grows, the true costs of every new visitor are fully covered.

Amid increasing concern about “overtourism” and calls from within the travel industry for improved destination management, the report, Destinations at Risk: The Invisible Burden of Tourism, was commissioned by the Travel Foundation to better understand the challenges and constraints that national and municipal authorities face. It provides a thorough review of the risks that destinations face and the solutions urgently needed, including:

  • New local accounting systems that capture the full range of costs stemming from the growth of tourism, in place of an incomplete set of economic impact measures.
  • New skills and cross sector collaboration, underpinned by data and technology, to achieve effective spatial planning, manage demand for public utilities and services, and evaluate the availability of vital, local resources.
  • New valuation and financing mechanisms to redress debilitating underinvestment in infrastructure and local asset management and enable the transition to low-carbon destination economies.

Principal report author, Megan Epler Wood, said: “The Earth’s greatest treasures are cracking under the weight of the soaring tourism economy.  New data-driven systems to identify the cost of managing tourism’s most valued assets are required to stem a growing crisis in global tourism management.  With the right leadership, finance and analysis in place, a whole new generation of tourism professionals can move forward and erase the invisible burden while benefiting millions around the globe.”

Salli Felton, CEO of the Travel Foundation, said: “The invisible burden goes a long way to explain why we are now witnessing destinations failing to cope with tourism growth, despite the economic benefits it brings. It’s not enough to call on governments and municipalities to manage tourism better, if they don’t have access to the right skills and resources to do so. Destination managers need support to develop new skills and new ways of working that will enable them to move beyond tourism marketing.”

Dr Mark Milstein, co-author of the report, said: “This is a challenge of investing for the long-term health of a critical global economic sector. Future success will require collaboration among business, government, and civil society so that destinations are managed as the valuable, yet vulnerable, assets that they are.”

The authors conclude that some destinations are more vulnerable to the invisible burden and should be prioritised. For instance:

  1. Where there is a high risk of climate change impacts (which would disproportionately affect a visitor economy) – for instance, island states.
  2. Where the rise of the global middle class is driving tourism growth at unsustainable levels – for instance, in Southern and Southeast Asia.
  3. Where there is a high percentage of economic dependence on tourism – for instance, in the Caribbean.
  4. Where the ability of local government to manage tourism growth is low, in terms of budgets and human capital – a problem that has been found in both advanced and emerging economies.

The analysis draws upon academic literature, case studies, expert interviews and media reports, and provides a wealth of examples of the invisible burden.  Cases are drawn from Thailand, Mexico, and the Maldives, as well as Europe, Africa, and Latin America. The report also gives insights into types of data-driven systems, such as GIS mapping tools and the Smart Cities concept, which can address growth issues and facilitate new forms of investment.

The free report is available at invisibleburden.org.

Travel News | eTurboNews

Share this:

  • Twitter
  • Facebook

Filed Under: Press Release Tagged With: and, around the globe, Asia, assets, author, authorities, benefits, better, Breaking Travel News, budgets, Burden, Business, capital, carbon, Caribbean, case, Centre, CEO, challenge, challenges, change, cities, class, climate, Climate Change, collaboration, community, concept, concern, COPE, Cornell, cost, costs, crises, Crisis, critical, cultural, Cultural Travel News, currently, Data, demand, Destination, Destination Management, Destinations, dissatisfaction, Dr, driving, Earth, economic, economic impact, economies, Economy, ecosystems, emerging, emerging economies, enterprise, environment, environmental, estate, Europe, expert, expertise, face, failing, Felton, Finance, financing, forms, Forward, found, foundation, free, full, future, GIS, Global, global economic, global tourism, Globe, government, governments, greatest, Growth, habitats, HEALTH, hidden, hidden costs, high, impact, impacts, improved, in, including, increasing, Industry, infrastructure, Insights, International, Interviews, Investing, Investment, invisible, invisible burden, island, island states, issues, IT, Latin, Latin America, leadership, leading, life, literature, local, local government, locals, low, low-carbon, maldives, Manage, management, managers, Managing, Marketing, measures, media, media reports, meet, Mexico, Middle, middle class, millions, monuments, most, move, municipalities, national, natural, need, needed, needs, New, new data, new generation, News articles, paid, pay, percentage, Place, places, planning, prices, problem, professionals, protect, public, published, range, real, Real Estate, report, reports, require, residents, resources, Responsible Tourism News, review, right, rise, rising, Risk, risks, s, said, sector, services, skills, society, solutions, Southeast, Southeast Asia, Southern, spatial, states, STEM, studies, success, support, sustainable, Technology, term, terms, thailand, the Caribbean, to, TO DO, today, tools, tourism, tourism assets, tourism demand, tourism economy, Tourism growth, Tourism Industry, tourism management, tourism marketing, tourism professionals, transition, Travel, Travel Foundation, Travel Industry, Travelwire News, treasures, university, upgrade, visitor, visitor economy, Vital, vulnerable, way, ways, We, weak, wealth, weight, Why, wonders, working, worldwide

Hawaii Tourism: Hawaii hotels’ occupancy, revenue down in February 2019

March 25, 2019 by Forimmediaterelease

In February 2019, Hawaii hotels statewide reported decreases in both average daily rate (ADR) and occupancy, which resulted in lower revenue per available room (RevPAR) compared to February 2018.

According to the Hawaii Hotel Performance Report published by the Hawaii Tourism Authority (HTA), statewide RevPAR declined to $242 (-4.2%), with ADR of $290 (-1.2%) and occupancy of 83.4 percent (-2.6 percentage points) (Figure 1) in February.

HTA’s Tourism Research Division issued the report’s findings utilizing data compiled by STR, Inc., which conducts the largest and most comprehensive survey of hotel properties in the Hawaiian Islands.

In February, Hawaii hotel room revenues fell by 5.6 percent to $360.0 million. There were more than 22,000 fewer available room nights (-1.5%) in February and approximately 58,000 fewer occupied room nights (-4.5%) compared to a year ago (Figure 2). Several hotel properties across the state were closed for renovation or had rooms out of service for renovation during February.

All classes of Hawaii hotel properties statewide reported RevPAR declines in February, except Upper Midscale Class properties ($149, +2.5%). Luxury Class properties reported RevPAR of $447 (-6.2%) with ADR of $574 (-2.2%) and occupancy of 77.9 percent
(-3.4 percentage points). At the other end of the price scale, Midscale & Economy Class hotels reported RevPAR of $154
 (-10.3%) with ADR of $181 (-6.8%) and occupancy of 85.3 percent (-3.4 percentage points).

Among Hawaii’s four island counties, only Oahu hotels reported ADR growth for February ($237, +1.2%). This increase was counter-balanced by a 1.0 percentage point decrease in occupancy to 86.4 percent, resulting in no RevPAR growth in February ($205) compared to a year ago.

Maui County hotels reported a decline in RevPAR to $337 (-4.5%) in February but led the state overall. Both ADR ($420, -2.9%) and occupancy (80.3, -1.3 percentage points) decreased year-over-year.

Hotels on the island of Hawaii reported a drop in RevPAR to $233 (-13.5%) in February, with lower ADR ($285, -5.8%) and occupancy (81.8%, -7.3 percentage points) compared to February 2018.

Kauai hotels’ RevPAR fell to $230 (-12.3%) in February, with declines in both ADR to $306 (-1.3%) and occupancy to 75.1 percent (-9.4 percentage points).

All of Hawaii’s resort regions reported RevPAR and occupancy losses in February. Only Waikiki properties were able to raise ADR for the month ($232, +1.0%) compared to a year ago.

Travel News | eTurboNews

Share this:

  • Twitter
  • Facebook

Filed Under: Press Release Tagged With: and, authority, average, Breaking Travel News, class, Class hotels, classes, closed, compared, counter, County, daily, Data, decline, declined, declines, decrease, decreased, Division, down, drop, Economy, economy class, end, fewer, findings, free, Government Affairs, Growth, Hawaii, Hawaii Hotel Performance Report, Hawaii tourism, Hawaii Tourism Authority, Hawaii Travel News, Hawaiian, hawaiian islands, Hospitality News, hotel, hotel room, Hotel Travel News, Hotels, HTA, in, In February, Inc, increase, island, islands, issued, Kauai, largest, LED, losses, lower, Luxury, Maui, million, month, most, News articles, nights, Oahu, occupancy, only, out, over, percent, percentage, performance, points, price, properties, published, raise, rate, regions, renovation, report, reported, research, resort, Resort News, resulted, Revenue, revenue per available room, revenues, REVPar, room, room nights, rooms, s, service, State, STR, survey, to, tourism, tourism authority, tourism research, Travel & Tourism Organizations News, Travel Destination News, Travelwire News, Waikiki, were, year

Ethiopian Airlines CEO believes in The New Spirit of Africa and pledges to work with Boeing

March 25, 2019 by Forimmediaterelease

Tewolde GebreMariam, Group CEO, Ethiopian Airlines issued a statement today.

He wrote: “It has been more than two weeks since the tragic crash of Ethiopian Airlines flight 302. The heartbreak for the families of the passengers and crew who perished will be lasting. This has forever changed their lives, and we at Ethiopian Airlines will feel the pain forever. I pray that we all continue to find strength in the weeks and months ahead.

The people of Ethiopia feel this very deeply, too. As a state-owned airline and the flagship carrier for our nation, we carry the torch for the Ethiopian brand around the world. In a nation that sometimes is saddled with negative stereotypes, accidents like this affect our sense of pride.

Yet this tragedy won’t define us. We pledge to work with Boeing and our colleagues in all the airlines to make air travel even safer.

As the largest aviation group on the continent of Africa, we represent The New Spirit of Africa and will continue to move forward. We are rated as a 4-star global airline with a high safety record and member of Star Alliance. That will not change.

Full Cooperation

The investigation of the accident is well underway, and we will learn the truth. At this time, I do not want to speculate as to the cause. Many questions on the B-737 MAX airplane remain without answers, and I pledge full and transparent cooperation to discover what went wrong.

As it is well known in our global aviation industry, the differences training between the B-737 NG and the B-737 MAX recommended by Boeing and approved by the U.S. Federal Aviation Administration called for computer-based training, but we went beyond that. After the Lion Air accident in October, our pilots who fly the Boeing 737 Max 8 were fully trained on the service bulletin issued by Boeing and the Emergency Airworthiness Directive issued by the USA FAA. Among the seven Full Flight Simulators that we own and operate, two of them are for B-737 NG and the B-737 MAX. We are the only airline in Africa among the very few in the world with the B-737 MAX full flight Simulator. Contrary to some media reports, our pilots who fly the new model were trained on all appropriate simulators.

The crews were well trained on this aircraft.

Immediately after the crash and owing to the similarity with the Lion Air Accident, we grounded our fleet of Max 8s. Within days, the plane had been grounded around the world. I fully support this. Until we have answers, putting one more life at risk is too much.

Belief in Boeing, U.S. Aviation

Let me be clear: Ethiopian Airlines believes in Boeing. They have been a partner of ours for many years. More than two-thirds of our fleet is Boeing. We were the first African airline to fly the 767, 757, 777-200LR, and we were the second nation in the world (after Japan) to take delivery of the 787 Dreamliner. Less than a month ago, we took delivery of yet another new two 737 cargo planes (a different version from the one that crashed). The plane that crashed was less than five months old.

Despite the tragedy, Boeing and Ethiopian Airlines will continue to be linked well into the future.

We also are proud of our association with U.S. aviation. The general public does not know that Ethiopian Airlines was founded in 1945 with help from Trans World Airlines (TWA). In the early years, our pilots, flight crews, mechanics and managers were actually employees of TWA.

In the 1960s, after the handoff, TWA continued in an advisory capacity, and we’ve continued to use American jets, American jet engines and American technology. Our mechanics are Federal Aviation Administration (FAA) certified.

Our first direct passenger service to the U.S. began in June 1998, and today we fly direct to Africa from Washington, Newark, Chicago and Los Angeles. This summer, we will begin flying from Houston. Our cargo flights connect in Miami, Los Angeles and New York.

U.S. travel to Africa has increased more than 10 percent in the last year, second only to travel to Europe in term of the percentage increase — traveling to Africa has increased more than traveling to Asia, the Middle East, Oceania, South America, Central America or the Caribbean. The future is bright, and Ethiopian Airlines will be here to meet the demand.

In less than a decade, Ethiopian Airlines has tripled the size of its fleet – we now have 113 Boeing, Airbus and Bombardier aircraft flying to 119 international destinations in five continents. We have one of the youngest fleet in the industry; our average fleet age is five years while industry average is 12 years. Moreover, we have tripled the passenger volume, now flying more than 11 million passengers annually.

Each year, our Aviation Academy trains more than 2,000 pilots, flight attendants, maintenance workers and other employees for Ethiopian Airlines and several other African airlines. We are the company others turn to for aviation expertise. In the last 5 years, we have invested more than half a Billion dollars in training and other infrastructure in our Addis Ababa base.

We will work with investigators in Ethiopia, in the U.S. and elsewhere to figure out what went wrong with flight 302.

We resolve to work with Boeing and others to use this tragedy to make the skies safer for the world.”

Travel News | eTurboNews

Share this:

  • Twitter
  • Facebook

Filed Under: Press Release Tagged With: and, Angeles, answers, approved, around the world, Asia, association, average, aviation, Aviation Administration, aviation industry, Aviation News, aviation-website, B, base, based, begin, billion, billion dollars, Boeing, Boeing 737, Bombardier, brand, Breaking Travel News, capacity, cargo, cargo flights, Caribbean, carrier, Cause, Central, Central America, CEO, certified, change, changed, Chicago, Clear, colleagues, company, Computer, connect, continent, continue, continued, cooperation, crash, crashed, crew, crews, decade, delivery, demand, Destinations, differences, different, direct, dollars, Dreamliner, early, East, emergency, employees, engines, Ethiopia, Ethiopia travel news, Ethiopian, Ethiopian Airlines, Ethiopian airlines ceo, Ethiopian Airlines Flight, Europe, even, expertise, FAA, families, Feature, federal, Federal Aviation Administration, find, first, flagship, flagship carrier, fleet, flight, flight attendants, flight simulator, flights, fly by, Flying, Forward, full, future, GebreMariam, general, Global, global aviation, grounded, Group, Group CEO, half, help, high, Houston, I do, immediately, in, increase, increased, Industry, infrastructure, International, international destinations, invested, investigation, investigators, issued, IT, japan, jet, jets, June, largest, last, learn, less, Let, life, like, linked, lion, Lion Air, Los Angeles, maintenance, Make, managers, MAX, mechanics, media, media reports, meet, member, Miami, Middle, Middle East, million, million passengers, model, month, months, move, nation, negative, New, new york, Newark, NG, October, only, operate, out, pain, partner, passenger, passenger service, passenger volume, passengers, People, percent, percentage, pilots, planes, pledge, pray, Pride, proud, public, putting, questions, record, reports, resolve, Risk, s, Safety, second, service, seven, simulator, Size, skies, South, South America, Spirit, Star, Star Alliance, State, statement, strength, summer, support, Technology, term, Tewolde, Tewolde Gebremariam, the Caribbean, The World, time, to, TO BE, today, torch, tragedy, Tragic, training, trains, Trans, transparent, Transportation News, Travel, Travel Disaster & Emergency News, travel to europe, traveling, Travelwire News, truth, turn, TWA, TWA continued, U.S, U.S. travel, underway, US, USA, use, Washington, We, weeks, went, were, WHO, won, work, workers, World, wrong, wrote, year, years, York

  • 1
  • 2
  • Next Page »

Search


Recent Articles

  • Coronavirus Disease 2019 (COVID-19) situation in Thailand as of 21 April 2021, 11.30 Hrs.
  • ‘Entry Thailand’ online information centre launched for vaccinated international visitors
  • Jamaica Tourism Minister: Building Forward Stronger – Tourism 2021 and Beyond
  • The prestigious 2021 MICHELIN Guide Malta awards stars to two more restaurants as the Mediterranean archipelago establishes itself as a gastronomic destination
  • The Bahamas launches virtual People-to-People experiences
  • Farewell Gate 35X: American Airlines Welcomes Customers to a New Regional Concourse at Ronald Reagan Washington National Airport
  • Marriott International Signs Agreement to Debut JW Marriott Brand in Spain
  • Coronavirus Disease 2019 (COVID-19) situation in Thailand as of 20 April 2021, 11.30 Hrs.
  • Airlines waive fees as CAAT calls for suspension of late-night domestic flights
  • United Releases First-Quarter Financial Results – Rebounding Demand is Driving Clear Path to Profitability

Copyright © 2021 · Metro Pro on Genesis Framework · WordPress · Log in