• Home
  • Post a press-release
  • Visibility packages
  • Subscribe email updates
  • Event Calendar
  • Contact

For Immediate Release | Official News Wire for the Travel Industry

Where press releases are breaking news

  • Home
  • Post a press-release
  • Visibility packages
  • Subscribe email updates
  • Event Calendar
  • Contact

Brexit has not deterred business travelers in the UK

April 17, 2019 by Forimmediaterelease

UK’s 2018 Hotels Market Report shows that the UK regional capitals are performing strongly with overall room nights booked growing by 8% across the top 250 UK cities.

London continues to be business travelers’ favorite capital for work trips with 663,000 room nights booked in 2018, an increase of 5% when compared to 2017. But Edinburgh experienced the highest level of growth in 2018 with room nights booked increasing by 16%, Belfast was up 13% and Cardiff up 5%.

The 2018 Hotels Market Report analyses data from corporate hotel bookings made between January and December 2018 by Advantage’s TMC members, who represent around 40% of the UK business travel sector, highlighting business travel trends and booking behaviour.

The report also shows significant growth for cities in the Midlands and North East, with Derby seeing the highest growth with 31% more booked room nights compared to 2017, while York, Nottingham and Gateshead also saw double-digit percentage increases.

Top Ten UK Cities – Booked Room Night Percentage Increase (year-on-year), January – December 2018

1. Derby – 31%
2. York – 22%
3. Plymouth – 21%
4. Inverness – 20%
5. Nottingham – 18%
6. Edinburgh – 16%
7. Reading – 15%
8. Belfast – 13%
9. Norwich – 11%
10. Gateshead – 10%

Global Results

The business world continues to travel widely, with the 2018 Hotels Report recording that hotel demand remains strong in many international cities with New York, Auckland, Wellington, Houston, Paris and Sydney topping the Advantage Top Cities list. In total, worldwide volume grew by over 393,000 room nights, a total increase of 8.74% compared to 2017, indicating that SME (Small and Medium Enterprise) corporate accounts, in which Advantage TMCs specialise, continue to perform strongly.

The total number of bookings made by Advantage business travel members in 2018 saw similar growth – up 8.76% – while the average length of stay remained constant, at 1.87 nights. Increased demand and higher occupancy globally meant hotel rates have increased by US$2 to an average daily rate (ADR) of US$169.41.

The report also looks at trends on bookings and ADR for cities and locations around the world, with New York once again topping the list as the highest volume worldwide city outside the UK, with 90,799 room nights booked at an average rate of US$395.97 per night. Increases were also seen in Bangalore (up 54%), Kuala Lumpur (up 36%) and Boston (up 27%).

The corporate hotel sector continues to grow, with another significant increase in bookings year-on-year, made by independent TMCs. Despite continued uncertainty in both the global and UK economies including Brexit, hotel room night demand is at record levels in many destinations. Although not all destinations in Britain saw an increase in room nights booked, ADR remained strong.

The report is representative of hotel bookings made across most of the major international and independent hotel groups including: Accor, Apex Hotels, Choice Hotels, Citadines, Clayton Hotels, Design Hotels, The Doyle Collection, Edwardian Hotels, glh Hotels, Hallmark Hotels, Hilton, HotelREZ, Hyatt, House of Daniel Thwaites, IHG, Jurys Inn & Leonardo Hotels, Loews Hotels, Macdonald Hotels, Maldron Hotels, Melia Hotels International, Millennium Hotels & Resorts, The Montcalm Hotels, NH Hotels, O’Callaghan Collection, Omni, Park Plaza, Pegasus, QHotels, Quest, Rotana, Radisson Hotel Group, Sabre Hospitality, Small Luxury Hotels, TravelClick, Travelodge, Village Hotels Club, WorldHotels Collection and Wyndham Hotel Group.

Travel News | eTurboNews

Share this:

  • Twitter
  • Facebook

Filed Under: Press Release Tagged With: and, apex, around the world, Auckland, average, Bangalore, Belfast, booked, Booking, bookings, Boston, Breaking Travel News, Brexit, Britain, Business, Business Travel, business travelers, capital, capitals, choice, Choice Hotels, cities, city, club, collection, compared, continue, continued, continues, corporate, daily, Daniel, Data, December, demand, design, Design Hotels, Destinations, double, East, economies, Edinburgh, enterprise, experienced, favorite, free, Global, global results, globally, Group, groups, grow, Growing, Growth, higher, highest, Hilton, hospitality, Hospitality News, hotel, hotel bookings, Hotel Group, hotel rates, hotel room, Hotel Travel News, Hotels, Hotels International, Hotels Market Report, house, Houston, Hyatt, IHG, in, including, increase, increased, increases, increasing, independent, inn, International, International Travel News, Inverness, January, Kuala Lumpur, length of stay, list, locations, London, Lumpur, Luxury, luxury hotels, Macdonald, major, Market, Market Report, Medium, melia hotels, members, MICE Industry News, Millennium, most, New, new york, News articles, NH, NH Hotels, night, nights, North, Nottingham, number, occupancy, outside, over, Paris, park, Park Plaza, Pegasus, percentage, perform, performing, quest, Radisson, Radisson Hotel Group, rate, rates, reading, record, record levels, regional, remained, remains, report, represent, representative, Resort News, resorts, results, room, room nights, Rotana, s, Sabre, sector, seeing, shows, significant, significant growth, small, SME, stay, strong, Sydney, The World, TMC, to, TO BE, top, top cities, top ten, total, tourism, Travel, Travel & Tourism Organizations News, Travel Destination News, travel sector, travel trends, travelers, TraveLodge, Travelwire News, Trends, trips, UK, UK business, UK Travel News, uncertainty, up, US, village, were, WHO, work, World, Worldhotels, worldwide, Wyndham, Wyndham Hotel Group, year, York

IATA Report: Aviation continues to deliver solid

April 4, 2019 by Forimmediaterelease

The International Air Transport Association (IATA) announced global passenger traffic results for February 2019 showing total revenue passenger kilometers (RPKs) rose 5.3%, compared to February 2018. This was the slowest rate of growth in more than a year but still in line with long-term demand trends. Monthly capacity (available seat kilometers or ASKs) increased by 5.4%, and load factor slipped 0.1 percentage point to 80.6%, which is still high by historic standards.

“After January’s strong performance, we settled down a bit in February, in line with concerns about the broader economic outlook. Continuing trade tensions between the US and China, and unresolved uncertainty over Brexit are also weighing on the outlook for travel,” said Alexandre de Juniac, IATA’s Director General and CEO.

February 2019
(% year-on-year)
World share1 RPK ASK PLF
(%-pt)2
PLF
(level)3
Total Market 100.0% 5.3% 5.4% -0.1% 80.6%
Africa 2.1% 2.8% 1.1% 1.1% 70.4%
Asia Pacific 34.5% 6.3% 5.8% 0.4% 82.6%
Europe 26.7% 7.3% 7.7% -0.3% 81.5%
Latin America 5.1% 5.0% 5.5% -0.4% 81.3%
Middle East 9.2% -0.9% 2.7% -2.6% 72.6%
North America 22.4% 4.2% 3.9% 0.3% 80.8%


nternational Passenger Markets

February international passenger demand rose 4.6% compared to February 2018, which was a slowdown from 5.9% growth in January. Capacity climbed 5.1%, and load factor dropped 0.4 percentage point to 79.5%. Airlines in all regions but the Middle East showed traffic growth versus the year-ago period.

  • European carriers showed the strongest performance for a fifth consecutive month in February. Passenger demand increased by 7.6%, compared to a year ago, unchanged from January. Europe’s continuing strong performance provides a paradox given Brexit concerns and signs of a softer economic outlook. Capacity rose 8.0% and load factor slid 0.3 percentage point to 82.3%, which still was the highest among regions.
  • Asia-Pacific airlines’ February traffic rose 4.2% compared to the year-ago period, a substantial slowdown from the 7.2% increase recorded in January. The timing of the Lunar New Year holiday in the first week of February this year may have shifted some traffic to January. Capacity increased 4.7% and load factor dipped 0.3 percentage point to 81.0%.
  • Middle East carriers recorded a 0.8% traffic decline in February compared to a year ago, the only region to report a drop year-over-year. Capacity rose 2.9% and load factor fell 2.7 percentage points to 72.6%. Broadly speaking, passenger volumes of the region’s airlines have been moving sideways for the past 12 – 15 months.
  • North American airlines’ traffic climbed 4.2% in February, a decline from 5.4% growth in January. Capacity rose 2.9% and load factor was up 1.0 percentage point to 79.0%. Signs of softening economic activity at the end of 2018, in conjunction with the effects of ongoing tensions between the US and several of its trading partners, may be mitigated by the region’s low unemployment and generally sound economic backdrop.
  • Latin American airlines saw traffic rise 4.3% compared to February 2018, a slippage from 5.4% annual growth in January. Capacity increased by 5.6%, and load factor dropped 1.0 percentage point to 81.4%. Renewed economic and political uncertainties in a number of key countries may weigh upon air transport demand in coming months.
  • African airlines experienced a 2.5% rise in traffic for the month compared to the year-ago period, down from 5.1% growth in January. Concerns over conditions in the largest economies are contributing to the slowdown. Capacity rose 0.3%, and load factor climbed 1.5 percentage points to 69.7%.

Domestic Passenger Markets

Domestic travel demand rose 6.4% in February compared to February 2018, down from 7.4% annual growth in January. All markets except Australia reported increases in traffic, with India recording its 54th consecutive month of double-digit percentage growth. Domestic capacity climbed 5.8%, and load factor edged up 0.5 percentage point to 82.4%.

February 2019
(% year-on-year)
World share1 RPK ASK PLF
(%-pt)2
PLF
(level)3
Domestic 36.1% 6.4% 5.8% 0.5% 82.4%
Australia 0.9% -1.7% -1.6% -0.1% 78.0%
Brazil 1.1% 5.8% 3.1% 2.1% 82.5%
China P.R 9.5% 11.4% 8.9% 1.9% 86.9%
India 1.6% 10.0% 12.3% -1.9% 89.1%
Japan 1.0% 2.5% 2.9% -0.2% 70.9%
Russian Fed. 1.4% 10.1% 11.8% -1.1% 76.9%
US 14.1% 4.5% 4.8% -0.2% 81.7%


  • China topped the growth chart for a second month in a row, with RPKs up a strong 11.4% year-on-year, although this was down from 14.5% growth in January compared to a year ago.
  • Brazil’s domestic traffic increased 5.8% in February, compared to a year ago, the fastest pace in more than six months and more than double the 2.6% year-over-year rise for January. Brazil was the only domestic market tracked by IATA to show an increase in the year-on-year growth rate compared to January 2019.

The Bottom Line

“While overall economic confidence appears to be softening, aviation continues to deliver solid results, helping to sustain global commerce and the movement of people. The Brexit deadline has come and gone with no separation agreement, but with vital air connectivity between the UK and the Continent maintained for the present. Temporary measures, however, are no substitute for a comprehensive Brexit package that will ensure that the Business of Freedom is able to play its vital role in contributing to the well-being of the region—and the world,” said de Juniac.

Read the full February Passenger Traffic Analysis  (pdf)

Travel News | eTurboNews

Share this:

  • Twitter
  • Facebook

Filed Under: Press Release Tagged With: and, announced, annual, Asia, Asia Pacific, association, Australia, aviation, Aviation News, aviation-website, backdrop, Bit, bottom line, Brazil, Breaking Travel News, Brexit, Business, capacity, carriers, CEO, China, come, coming, commerce, compared, concerns, conditions, confidence, connectivity, continent, continues, contributing, Corporate News, countries, deadline, decline, deliver, demand, demand rose, director, director general, domestic, domestic capacity, domestic market, domestic travel, double, down, drop, East, economic, economic outlook, economies, effects, end, Europe, European, European carriers, experienced, factor, first, freedom, full, general, Global, global passenger traffic, Growth, Growth Rate, Helping, high, highest, historic, holiday, IATA, in, In February, increase, increased, increases, India, International, International Air Transport Association, January, japan, Juniac, kilometers, largest, largest economies, Latin, Latin America, Latin American, line, load, load factor, low, lunar new year, Lunar New Year Holiday, Market, markets, May, measures, Middle, Middle East, month, months, movement, moving, nbsp, New, new year, News articles, North, North America, North American, North American airlines, number, ongoing, only, outlook, over, P.R, Pacific, package, partners, passenger, passenger demand, passenger markets, passenger traffic, past, People, percentage, performance, period, play, points, political, present, provides, pt, rate, recorded, region, regions, report, reported, results, Revenue, rise, role, rose, row, Russian, s, said, seat, second, separation, settled, show, Sideways, signs, slowdown, sound, standards, strong, strong performance, sustain, temporary, tensions, term, The International Air Transport Association, The Region, The World, timing, to, TO BE, total, tourism, Trade, trading, traffic, traffic growth, traffic results, traffic rose, transport, Transportation News, Travel, Travel & Tourism Organizations News, travel demand, Travel Destination News, Travel Technology News, Travelwire News, Trends, UK, UK Travel News, uncertainty, unchanged, unemployment, up, US, Vital, volumes, We, week, World, year

Aviation Safety: Fatigue management

March 28, 2019 by Forimmediaterelease

In aviation operations, managing fatigue is important because it diminishes an individual’s ability to perform almost all operational tasks. This clearly has implications for operational efficiency, but in situations where individuals are undertaking safety-critical activities, fatigue-effected performance can also have consequences for safety outcomes. Fatigue is a natural consequence of human physiology.

Because fatigue is affected by all waking activities (not only work demands), fatigue management has to be a shared responsibility between the State, service providers and individuals.

A brief history of flight and/or duty limitations

For most workers, hours of work are part of the working conditions and remuneration packages established through industrial agreements or social legislation. They are not necessarily established from a safety perspective.

However, the need to limit pilots’ flight and duty hours for the purpose of flight safety was recognized in ICAO Standards and Recommended Practices (SARPs) in the first edition of Annex 6 published in 1949.  At that time, ICAO SARPs required the operator to be responsible for establishing flight time limits that ensured that “fatigue, either occurring in a flight or successive flights or accumulating over a period of time, did not endanger the safety of a flight”. These limits had to be approved by the State.

By 1995, ICAO SARPs required States to establish flight time, flight duty periods and rest periods for international flight and cabin crew. The onus was on the State to identify “informed boundaries” that aimed to address the general fatigue risk for flight operations nationally. At no time have ICAO SARPs identified actual flight and duty hours because it had proven impossible to identify global limits that adequately addressed operational contexts in different regions.While ICAO SARPs apply only to international operations, many States also chose to establish similar flight and duty time limitations for domestic operations. States generally used the same flight and duty limits for helicopter crew as for airline crew.

The fallacy of flight and/or duty limitations is that staying within them means that operations are always safe. Buying into this fallacy suggests that scheduling to the limits is enough to manage fatigue-related risks. However, more recent SARP amendments related to prescriptive limits have highlighted the responsibilities of the operator to manage their particular fatigue-related risks within the limits using their SMS processes.

And then there was FRMS….

Fatigue Risk Management Systems (FRMS) represent an opportunity for operators to use their resources more efficiently and increase operational flexibility outside the prescriptive limits, whilst maintaining or even improving safety. In implementing an FRMS, the onus shifts to the operator to prove to the State that what they propose to do and how they continue to operate under an FRMS, is safe.

In 2011, SARPs enabling FRMS as an alternative means of compliance to prescriptive limitations were developed for aeroplane flight and cabin crew (Annex 6, Part I).  At the time of development, it was necessary to address concerns that airline operators would take this as an opportunity to schedule purely for economic benefits at the cost of safety. Therefore, while often referred to as “performance-based” approach, the FRMS SARPs are nevertheless very prescriptive about the necessary elements of an FRMS and require the explicit approval of an operator’s FRMS by the State.

Since then, similar FRMS SARPs were made applicable for helicopter flight and cabin crew in 2018 (Annex 6, Part III, Section II).

But what about air traffic controllers?

Despite their obvious impact on flight safety outcomes, ICAO SARPs have never required the hours of work to be limited for air traffic controllers even though some States have had hours of duty limitations for air traffic controllers for many years. This is about to change. Amendments to Annex 11, becoming applicable in 2020, will require that ICAO States establish duty limits and specify certain scheduling practices for air traffic controllers. As for international airline and helicopter operations, States will have the option of establishing FRMS regulations for air traffic service providers.

Fatigue Management SARPs today

Today, ICAO’s fatigue management SARPs support both prescriptive and FRMS approaches for managing fatigue such that:

  • Both approaches are based on scientific principles, knowledge and operational experience that take into account:
    • the need for adequate sleep (not just resting while awake) to restore and maintain all aspects of waking function (including alertness, physical and mental performance, and mood);
    • the circadian rhythms that drive changes in the ability to perform mental and physical work, and in sleep propensity (the ability to fall asleep and stay asleep), across the 24h day;
    • interactions between fatigue and workload in their effects on physical and mental performance; and
    • the operational context and the safety risk that a fatigue-impaired individual represents in that context.
  • States continue to be obliged to have flight and duty time limitations but are under no obligation to establish FRMS regulations. Where FRMS regulations are established, the operator/service provider, can manage none, some or all of its operations under an FRMS, once approved to do so.
  • Prescriptive fatigue management regulations now provide the baseline, in terms of safety equivalence, from which an FRMS is assessed.

In practice…

In Airlines:  The Fatigue Management amendments to the Annex 6, Part I, in 2011 led many States  to reviewing their prescriptive limitation regulations for pilots based on scientific principles and knowledge (refer text box) and identifying further requirements for operators to manage their fatigue-related risks within the prescribed limits.  Fewer States have reviewed their prescriptive limitation regulations for cabin crew.

In every case, despite a refocus on providing adequate opportunities for sleep and recovery, altering existing flight and duty limitations remains a very sensitive and difficult task because it impacts income and work conditions as well as the constraints of pre-existing employment agreements. It is made even more challenging for States whose flight and duty time limitations are legislated.

Where States have reviewed their prescribed flight and duty limits, the increased awareness of the relationship between sleep and performance has served to highlight the responsibilities of the individual crew member and the airline to manage fatigue, and in some cases have resulted in the prescribed limits sitting alongside a set of regulations  that make these responsibilities more explicit, e.g. the FAA’s Fatigue Risk Management Program, EASA’s Fatigue Management requirements, CASA’s Fatigue Management requirements and CAA South Africa’s Fatigue Management Program.

The scientific principles of fatigue management


  1. Periods of wake need to be limited.  Getting enough sleep (both quantity and quality) on a regular basis is essential for restoring the brain and body.
  2. Reducing the amount or the quality of sleep, even for a single night, decreases the ability to function and increases sleepiness the next day.
  3. The circadian body-clock affects the timing and quality of sleep and produces daily highs and lows in performance on various tasks.
  4. Workload can contribute to an individual’s level of fatigue.  Low workload may unmask physiological sleepiness while high workload may exceed the capacity of a fatigued individual.

Many States have established, or plan to establish, FRMS regulations, often at the encouragement of their airlines. The FRMS challenge for States continues to be whether they have the resources to provide the necessary oversight from a scientific and performance-based perspective, particularly when the same regulations usually apply to a variety of domestic flight operations. While FRMS requirements are onerous and time-consuming, the few airlines who have so far managed to get FRMS approval for particular routes have found the operational flexibility gained to be worth the effort.

General scheduling principles


  1. The perfect schedule for the human body is daytime duties with unrestricted sleep at night. Anything else is a compromise.
  2. The circadian body clock does not adapt fully to altered schedules such as night work.
  3. Whenever a duty period overlaps a crew member’s usual sleep time, it can be expected to restrict sleep. Examples include early duty start times, late duty end times, and night work.
  4. The more that a duty period overlaps a crew member’s usual sleep time, the less sleep the crew member is likely to obtain. Working right through the usual nighttime sleep period is the worst case scenario.
  5. Night duty also requires working through the time in the circadian body clock cycle when self-rated fatigue and mood are worst and additional effort is required to maintain alertness and performance.
  6. The longer a crew member is awake, the worse their alertness and performance become.
  7. Across consecutive duties with restricted sleep, crew members will accumulate a sleep debt and fatigue-related impairment will increase.
  8. To recover from sleep debt, crew members need a minimum of two full nights of sleep in a row. The frequency of recovery breaks should be related to the rate of accumulation of sleep debt.
  9. Keep short notice changes to a minimum, especially where they infringe or overlap the  Window of Circadian Low (WOCL).
  10. Duty periods associated with high workload (such as multiple, challenging landings and in marginal weather conditions) may need to be shortened and extensions avoided where at all possible.

In Helicopter Operations:  For some States, the recent amendments to Annex 6, Part II (Section II) have highlighted the need to establish flight and duty time limits for helicopter crew members that better relate to the context of helicopter operations, rather than using the same limits as for airline pilots. Within those limits, the helicopter operator is expected to build crew schedules that use both fatigue science and operational knowledge and experience.

A new fatigue management guide for helicopter operators, currently under development in ICAO, identifies general scheduling principles based on fatigue science to guide helicopter operators in building “fatigue-aware” schedules that offer optimum opportunities for sleep and recovery (refer text box).

The particular challenge in helicopter operations, however, is that so many helicopter operations are unscheduled. While some helicopter operators will be able to operate within prescribed limits and effectively manage fatigue risks using an SMS, many types of helicopter operations, such as those that require unscheduled, immediate responses, possibly in high-risk settings, will benefit from the operational flexibility and safety gains of an FRMS.

In Air Traffic Control Services: Next year, States are expected to have established prescriptive work hour limits for air traffic controllers, while FRMS regulations remain optional and can be established at any time. However, the nature of the relationship between the Air Navigation Services Provider (ANSP) and the State will influence how the implementation of fatigue management regulations will unfold. In most cases, the State provides oversight of only one ANSP and although there is a current trend for privatisation, many of the ANSPs are fully or partially owned by the State.

In an industry sector that is often largely self-regulated, the distinction between a prescriptive fatigue management approach and FRMS may become blurred. However, a refocus on safety and not only organisational expediency or personal preference is likely to have substantial effects on the way controllers’ work schedules are built in ANSPs across the world. This is a “watch this space”.

Fatigue Management Guidance for ICAO States

The Manual for the Oversight of Fatigue Management Approaches (Doc 9966) received another update this year – Version 2 (Revised) – and an unedited version (in English only) will shortly replace the current manual available for download here. On this website you can also find the following:

  • Fatigue Management Guide for Airline Operators (2nd Edition, 2015)
  • Fatigue Management Guide for General Aviation Operators of Large and Turboject Aeroplane (1st Edition, 2016)
  • Fatigue Management Guide for Air Traffic Service Providers (1st Edition, 2016)
  • The Fatigue Management Guide for Helicopter Operators (1st Edition) is expected to be available later this year.

The Fatigue Management Guide for Helicopter Operators (1st Edition) is expected to be available later this year.

The author, Dr. Michelle Millar, is the Technical Officer (Human Factors) and the NGAP Program Manager at ICAO. She heads the ICAO FRMS Task Force and has been involved in the development of ICAO fatigue management provisions since 2009. Her academic background is in sleep, fatigue and performance.


Travel News | eTurboNews

Share this:

  • Twitter
  • Facebook

Filed Under: Press Release Tagged With: and, Annex, ANSP, apply, approval, approved, asleep, author, aviation, Aviation News, aviation safety, aviation-website, Aware, Awareness, based, benefit, benefits, better, body, Box, Breaking Travel News, breaks, brief, build, building, built, buying, CAA, cabin, cabin crew, capacity, case, challenge, change, changes, Compliance, compromise, concerns, conditions, continue, continues, control, controllers, cost, crew, crew member, crew members, critical, current, currently, daily, day, debt, demands, development, different, domestic, domestic operations, download, Dr, drive, duty, duty limits, early, EASA, economic, edition, effects, efficiency, effort, elements, employment, end, English, essential, establish, even, existing, expected, experience, FAA, factors, fall, far, fatigue, Fatigue Risk Management Program, Fatigue Science, fatigued, fewer, find, first, flight, flight operations, flight safety, flights, following, force, found, frequency, FRMS, FRMS SARP, full, function, G, gains, general, getting, Global, guidance, guide, Heads, helicopter, high, highlight, history, hours, Human, ICAO, II, impact, impacts, implementation, important, in, including, income, increase, increased, increases, individual, industrial, Industry, influence, International, international airline, IT, just, keep, knowledge, landings, late, later, LED, legislation, less, limit, Limited, limits, low, maintain, Make, Manage, management, Management Guide, manager, Managing, May, member, members, Michelle, most, nationally, natural, nature, navigation, nbsp, need, New, News articles, night, nights, notice, obligation, offer, officer, only, operate, operational, operations, operator, operators, opportunity, option, outside, over, oversight, packages, particularly, perform, performance, period, personal, physical, pilots, plan, practices, Pre, principles, privatisation, processes, program, propose, provides, published, purpose, quality, quantity, rate, received, recent, recover, recovery, regions, regular, regulations, relate, related, Relationship, remains, represents, require, requirements, resources, responsibility, responsible, restore, resulted, right, Risk, risk management, risks, routes, row, s, safe, Safety, SARP, SARPS, schedule, science, sector, service, service providers, services, short, single, sleep, SMS, social, South, South Africa, space, standards, start, State, states, stay, support, task, task force, Technical, terms, text, the crew, The World, through, time, times, timing, to, TO BE, TO DO, today, traffic, traffic controllers, Transportation News, Travelwire News, trend, update, use, used, using, usual, variety, way, weather, weather conditions, website, were, WHO, work, workers, working, World, worst, worth, year, years

Number of Hawaii visitors up but spending down

March 28, 2019 by Forimmediaterelease

Visitors to the Hawaiian Islands spent a total of $1.39 billion in February 2019, a decrease of 2.7 percent compared to February 20181, according to preliminary statistics released today by the Hawaii Tourism Authority. This is another dip following the 3.8 decrease in January.

In February, visitor spending increased from the U.S. West (+4.7% to $503.3 million) but declined from U.S. East (-6.7% to $370.9 million), Japan (-0.8% to $170.1 million), Canada (-0.7% to $150.7 million) and All Other International Markets (-15.3% to $188.7 million) compared to a year ago.

On a statewide level, average daily visitor spending was down slightly (-0.9% to $200 per person) in February year-over-year. Visitors from Japan (+3.3%), U.S. West (+1.2%) and All Other International Markets (+0.7%) spent more per day while visitors from U.S. East (-4.1%) and Canada (-1.0%) spent less.

A total of 782,584 visitors (+0.5%) came to Hawaii in February 2019, up slightly from the same month last year. Arrivals by air service (+0.3% to 766,293) were comparable to last February while arrivals by cruise ships (+12.1% to 16,291) increased. However, total visitor days2 declined (-1.9%) versus February 2018 due to a shorter average length of stay by visitors from most markets.

The average daily census3 of total visitors in the Hawaiian Islands on any given day in February was 248,244, down 1.9 percent compared to February last year. Arrivals by air service realized growth from U.S. West (+6.5%), Canada (+2.5%) and Japan (+1.1%) which offset decreases from U.S. East (-0.9%) and All Other International Markets (-17.2%).

Visitor spending on Oahu decreased (-1.6% to $613.0 million) while visitor arrivals (456,820) were flat compared to last February. Maui recorded increases in both visitor spending (+1.2% to $413.0 million) and visitor arrivals (+1.5% to 220,801). The island of Hawaii saw declines in visitor spending (-17.5% to $192.3 million) and visitor arrivals (-14.8% to 137,502). Visitor spending increased on Kauai (+4.7% to $153.5 million) while visitor arrivals were similar (+0.2% to 104,167) to February 2018.

A total of 1,010,961 trans-Pacific air seats serviced the Hawaiian Islands in February, up slightly (+0.5%) from a year ago. Growth in air seats from Canada (+10.9%), Japan (+6.3%), Oceania (+1.8%), U.S. West (+0.5%) and U.S. East (+0.5%) offset declines from Other Asia Markets (-25.1%).

Year-to-Date 2019

Through the first two months of 2019, visitor spending declined (-2.4% to $3.01 billion) compared to the same period last year. Visitor arrivals increased (+1.8% to 1,603,205) but a shorter length of stay (-1.8% to 9.43 days) resulted in no growth in visitor days. Average daily spending (-2.4% to $199 per person) was lower compared to a year ago.

Visitor spending decreased from U.S. West (-0.8% to $1.06 billion), U.S. East (-1.8% to $832.5 million), Japan (-3.8% to $349.6 million), Canada (-0.4% to $318.3 million) and All Other International markets (-7.5% to $443.2 million).

Visitor arrivals increased from U.S. West (+5.5% to 631,064), U.S. East (+0.7% to 356,943), Japan (+3.3% to 251,488) and Canada (+0.7% to 133,915), but declined from All Other International Markets (-7.9% to 201,981).

Other Highlights:

U.S. West: Visitor arrivals from the Pacific region rose 7.6 percent in February compared to the previous year, with more visitors from Alaska (+13.7%), California (+8.4%), Washington (+6.7%) and Oregon (+2.9%). Arrivals from the Mountain region were up 3.2 percent in February with growth from Arizona (+9.5%) and Nevada (+8.5%), offsetting declines from Utah (-5.7%) and Colorado (-1.3%). Through the first two months, arrivals from the Pacific (+7.4%) and Mountain (+1.8%) regions increased versus the same period last year.

Through February 2019, average daily visitor spending dropped to $182 per person (-2.4%) compared to the same period last year, largely due to decreases in transportation and food and beverage expenses.

U.S. East: Growth in February visitor arrivals from the East South Central (+1.6%) and East North Central (+0.6%) regions were offset by decreases from the West South Central (-4.1%), South Atlantic (-4.0%), New England (-2.4%) and Mid Atlantic (-0.7%) regions compared to a year ago. For the first two months of 2019, arrivals were up from the East South Central (+7.2%), West North Central (+2.6%) and South Atlantic (+0.7%) regions.

For the first two months of 2019, average daily visitor spending declined to $214 per person (-1.4%), largely due to a decline in transportation expenses.

Japan: In February, more visitors stayed in hotels (+5.2%) while stays in condominiums (-16.1%) and timeshares (-7.6%) decreased compared to a year ago.

For the first two months of 2019, average daily visitor spending declined to $238 per person (-4.4%), primarily due to lower lodging and transportation expenses.

Canada: In February, less visitors stayed in condominiums (-7.3%) and hotels (-1.6%). Stays in rental homes (+23.7%) and timeshares (+4.4%) increased from a year ago.

For the first two months of 2019, average daily visitor spending decreased (–0.7% to $177 per person) compared to the same period last year, due to lower shopping as well as entertainment and recreation expenses.

MCI: A total of 57,043 visitors came to the Hawaiian Islands for meetings, conventions and incentives (MCI) in February, an increase of 10.4 percent from last year. More visitors came to attend conventions (+18.6%) and corporate meetings (+2.2%) but fewer traveled on incentive trips (-1.0%). Contributing to the growth in convention visitors was the 2019 International Stroke Conference, held at the Hawaii Convention Center, which brought nearly 6,000 delegates. Through the first two months, total MCI visitors grew (+10.5% to 116,310) compared to the same period last year.

Travel News | eTurboNews

Share this:

  • Twitter
  • Facebook

Filed Under: Press Release Tagged With: and, Arizona, arrivals, Asia, Atlantic, attend, authority, average, beverage, billion, Breaking Travel News, California, Canada, center, Central, Colorado, compared, conference, contributing, convention, Convention Center, conventions, corporate, corporate meetings, Cruise ships, Cruise,, daily, date, day, Days, decline, declined, declines, decrease, decreased, delegates, dip, down, due, East, England, entertainment, expenses, fewer, first, flat, following, food, Growth, Hawaii, Hawaii Convention Center, Hawaii tourism, Hawaii Tourism Authority, Hawaii Travel News, hawaii visitors, Hawaiian, hawaiian islands, held, HITA, homes, Hotels, in, In February, Incentive, incentives, increase, increased, increases, International, international markets, island, islands, January, japan, Kauai, last, length of stay, less, lodging, lower, markets, Maui, mci, MCI visitors, meetings, million, month, months, most, mountain, nearly, Nevada, New, New England, News articles, North, number, Oahu, offset, Oregon, over, Pacific, percent, period, recorded, recreation, region, regions, released, rental, resulted, rose, s, seats, service, ships, shopping, shorter, South, spending, statistics, stay, stays, The Island, through, timeshares, to, today, total, tourism, tourism authority, Trans, trans-Pacific, Transportation, Travel & Tourism Organizations News, Travel Destination News, traveled, Travelwire News, trips, up, Utah, visitor, visitor arrivals, visitor spending, visitors, Washington, were, West, year

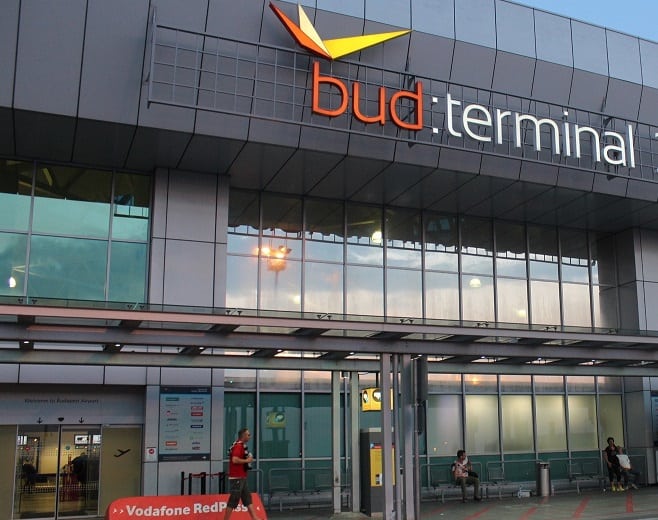
Budapest Airport launches new winter routes

March 27, 2019 by Forimmediaterelease

Launching 15 new winter routes in total, Ryanair route additions will see 3 new destinations on Budapest Airport’s route map. Facing no competition on its new operations to Lappeenranta, Luxembourg and Poznan, Ryanair will be providing further variety to passengers traveling to and from Hungary.

As Budapest Airport’s blistering summer schedule is launched this weekend, the Hungarian gateway continues its route network expansion into the winter timetable with Ryanair. Confirming the addition of another 6 new services – Catania, Gothenburg, Lappeenranta, Luxembourg, Poznan and Tel Aviv – the ultra-low-cost carrier (ULCC) will be offering a total of 46 routes from Budapest during the winter season.

“In just three years Ryanair has come close to doubling the number of passengers it has welcomed to Budapest Airport as early forecasts predict the carrier will deliver more than three million travelers to our gateway in 2019,” said Balázs Bogáts, Head of Airline Development, Budapest Airport. “Even before this summer season has begun, it’s great to announce that Ryanair will once again be enriching our route network from the winter with new destinations, as well as increased services on proven successful routes.”

As the ULCC also confirms frequency increases on its existing links to Berlin Schönefeld (9 times weekly), Copenhagen (daily), London Stansted (25 times weekly), Milan Bergamo (11 times weekly) and Prague (9 times weekly), an estimated over 3 million Ryanair customers will pass through Budapest throughout the summer and winter seasons, recording a robust growth of 17% and significantly reinforcing the airline’s growth at the Hungarian capital city airport.

Travel News | eTurboNews

Share this:

  • Twitter
  • Facebook

Filed Under: Press Release Tagged With: and, announce, Aviation News, aviation-website, Aviv, Bergamo, Berlin, Breaking Travel News, Budapest, Budapest airport, capital, capital city, carrier, Catania, city, close, come, competition, continues, Copenhagen, cost, customers, daily, deliver, Destinations, development, early, even, existing, expansion, forecasts, frequency, gateway, Gothenburg, Growth, head, Hungarian, Hungary, Hungary travel news, in, increased, increased services, increases, IT, just, launched, launches, launching, links, London, low, low-cost, low-cost carrier, Luxembourg, map, Milan, Milan Bergamo, million, network, New, new destinations, new services, News articles, number, offering, operations, over, pass, passengers, Prague, route, route network, routes, Ryanair, s, said, schedule, season, Seasons, see, services, significantly, Stansted, successful, summer, summer schedule, summer season, Tel, Tel Aviv, through, times, timetable, to, total, tourism, Transportation News, Travel Destination News, travelers, traveling, Travelwire News, ULCC, ultra, variety, weekend, weekly, welcomed, winter, winter routes, winter season, years

Five challenges confronting Meetings Industry in 2019

March 25, 2019 by Forimmediaterelease

Tight meeting budgets, time pressures, organizational issues, a lack of creativity from hotels, increasingly complex and costly mandates in catering, a need for more dynamic and enriching experiences and resistance to change – these are among the major challenges confronting the meetings industry in 2019.Teneo Hospitality Group surveyed 150 meeting planners and hoteliers on the challenges they faced in effectively competing in today’s changing and complicated marketplace. Interestingly, some of the challenges planners faced are internal, within their own organizations. All identified limited meetings budgets, lack of time and somewhat inflexible corporate cultures that gave rise to additional problems such as a lack of innovation and poor cost control.

“‘Many of these challenges – and their solutions – are interdependent,” says Teneo President Mike Schugt. He notes that meeting professionals are saying that they have concerns within their organization and corporate cultures which contribute to resistance to change, resulting in budgets that are impacted negatively. Planners are also saying that these challenges, coupled with the many demands on time, inhibit creative strategies that could otherwise help solve the obstacles pointed out in Teneo’s most recent survey.

“Teneo and its hotel and DMC members have a unique opportunity to step up and help solve the challenges of our planner partners,” says Mike Schugt. “We can introduce creative, time-saving offerings that can also meet their bottom line. By understanding the needs that go beyond rates, dates and space, hotels can provide innovative, solutions to the challenges planners face behind the scenes.”

Challenge #1 Budgets. Inadequate budgets headed the challenge lists for all survey participants. Planners cited rising costs, especially concerning food and beverage, with no comparable increase in budgets. The complexities of gaining budget increases from various corporate departments impact every aspect of the meeting process from training staff to negotiating contracts. Despite a strong economy, some planners reported budget cuts. Respondents noted that the inability to obtain adequate funding reflected a lack of understanding of the profound changes in the meetings industry that demanded more, not less, investment. Needs of attendees are very different today, especially among Millennials and Generation Z who require a high degree of technical services, greater engagement and entertaining activities – needs that are difficult to meet on a tight budget. Yet management and attendees had extremely high expectations.

Suggested Solution: The fundamental way planners can achieve their budget is to be transparent and in open communication with a property. Though the tendency may be to play one’s cards close to the vest, transparency from the beginning of negotiations is key to effective planning and keeping costs in check. While many planners feel they must keep back some of their budgetary concerns until further on in the planning process, an honest and comprehensive view of the meetings objectives and resources will enable hoteliers to present a realistic budget.

Challenge #2 Lack of Time. Time pressures impact every business and organization, but some concerns have particular ramifications for the meetings industry. Virtually all respondents cited a lack of time and identified challenges that could have far-reaching consequences. With sweeping advances in technology impacting the industry, hoteliers and planners noted that they often lacked the time to keep up with technical developments. This problem was amplified when attendees were ahead of the planners and hotels in their own use of technology. Training a new generation of meeting planners and hotel staff is key to the industry’s progress. But few had time to develop effective programs, tailored to meet the different viewpoints and technical skills of a new generation. Most significantly, respondents worried that the overwhelming details of day-to-day work left little time for long-term, strategic planning. And the top time waster? Too many unnecessary e-mails.

Suggested Solution: Hotels are often inundated with leads and may not always be able to reply in 24 hours. Planners are encouraged to indicate their timeline for response up front so hotels and resorts can offer a higher quality of response. For planners, they can then gather their lead responses all at one time and be assured that the quality of response is going to be higher if a little more time is allocated to the properties of interest. Planners that source more than 6 or 7 hotels per lead and in multiple cities will tend to be taken less seriously by a hotel. So planners can save time and drive up quality of response by reducing the number of hotel sources they contact.

If planners can share flexibility with dates early in the process, they will save time and the hotels can provide multiple options, which will likely have differences in pricing leading to greater value with the budget. Giving the hotel as much information as possible saves everyone time and can save on the budget.

Challenge #3 Keeping Up with Technology. In a technological environment that is moving at lightning speed, staying current and knowledgeable of technology’s impact on meeting productivity can be daunting. Realizing that millennial attendees may be way ahead in their technical knowledge, technology applications and expectations can be intimidating. Even leadership within select organizations don’t always seem to grasp how technology is revolutionizing the meetings experience today.

Suggested Solution: Staying current and out front with technological progress is critical to the successful outcome of every meeting, conference or social gathering. Yes, some long-term practices are still prized such as white boards and LCD players. But engaging with attendee devices puts the meeting’s learning literally in the hands of conferees in a way that resonates within a generation who grew up on texting, social media posts, interactive apps and more. These are the tools they use for their everyday living, and should be the tools they can expect to use within meetings important to their and their employer’s success.

Challenge #4 Lack of Creativity. Big brand hotels’ corporate bureaucracy partially accounts for planners’ demand for greater creativity in the meeting process, and a far more flexible business environment. Larger hotel brands often have corporate policies that may place limits on pushing the boundaries of creating the ultimate meeting experiences for planners. But the need for innovation and original events, imaginative use of technology, effective teambuilding exercises, new experiences in even the most tried and true destinations, and diverse, sustainable and healthy food cannot be ignored.

Suggested Solution: Partner with a hotel or resort that creatively works with planners and groups to construct a meeting itinerary customized to a specific group and set of meeting objectives. Independent and small brand properties, by the very nature of their independence, have proven to be expert in creatively discovering and helping plan for achieving meeting goals of professional planners and groups, doing so with out-of-the-box thinking, highly unique group initiatives, and far from run-of-the-mill teambuilding programming. Private destination management companies can also be an important resource, and Teneo suggests partnering with them to help make a city or destination come alive for meeting guests by maximizing local resources and attractions in a way that is meaningful to the group.

Challenge #5 Increasing Complexity and Rising Costs of Food & Beverage. As the population becomes more diverse, food preferences and dietary requirements have become more complicated. Growing awareness of wellness and sustainability issues add to a mix that could become more problematic and costlier. Paleo, keto, pescatarian, vegan and religious dietary requests are among the newest trends in conference dining in 2019. Respondents also called for better management of food ordering to keep costs down and eliminate waste.

Suggested Solution: This is an area where independent and small-brand hotels can get ultra-creative for the planner as they are in a more entrepreneurial and creative mode, less restricted by big-brand requirements and constraints. They can typically offer a more creative product with reduced costs. By working with chefs and banquet managers from these properties at the beginning of the planning process and being candid about budget constraints, it’s possible to obtain serious savings on food and beverage while achieving maximum creativity.

Travel News | eTurboNews

Share this:

  • Twitter
  • Facebook

Filed Under: Press Release Tagged With: and, applications, apps, area, Assured, attendees, attractions, Awareness, better, beverage, big, boards, bottom line, Box, brand, brands, Breaking Travel News, budget, budget cuts, budgets, Business, cards, catering, challenge, challenges, change, changes, check, chefs, cited, cities, city, close, come, Communication, companies, complex, concerns, conference, contact, contracts, control, corporate, Corporate News, cost, costs, creative, creativity, critical, cultures, current, cuts, day, demand, demands, Destination, Destination Management, Destinations, developments, devices, differences, different, dining, dmc, DMC members, doing, down, drive, e-mails, early, Economy, employer, encouraged, engagement, environment, even, Events, everyday, expectations, experience, experiences, expert, face, far, food, free, funding, gathering, giving, GO!, greater, Group, groups, guests, healthy, help, Helping, high, hospitality, hospitality group, hotel, Hotel brands, hoteliers, Hotels, hotels and resorts, hours, ignored, impact, important, in, increase, increases, increasing, independence, independent, Industry, information, initiatives, innovation, innovative, interactive, interest, International Travel News, introduce, Investment, issues, IT, itinerary, keep, knowledge, lack, LCD, LCD players, lead, leadership, leading, leads, learning, less, lightning, Limited, limits, line, Living, local, Make, management, managers, marketplace, May, media, meet, meeting, meeting planners, meeting professionals, meetings, meetings budgets, meetings industry, meetings.travel, members, MICE Industry News, Mike, millennials, more time, most, moving, nature, need, needs, negotiations, New, new generation, News articles, notes, number, offer, offerings, open, opportunity, options, ordering, organization, organizations, original, out, participants, partner, partners, Place, plan, Planners, planning, play, players, policies, poor, population, posts, practices, preferences, present, president, pricing, private, problem, problems, product, productivity, professional, professionals, programs, progress, properties, property, quality, rates, recent, recent survey, religious, reported, requests, require, requirements, resort, resorts, resource, resources, respondents, response, rise, rising, rising costs, s, save, savings, saying, says, serious, services, Share, significantly, skills, small, social, social media, Solution, solutions, Source, sources, space, staff, strategic, strategies, strong, success, successful, suggested, survey, Sustainability, sustainable, Technical, Technology, Teneo, Teneo Hospitality Group, Teneo President Mike Schugt, term, texting, time, timeline, to, TO BE, today, tools, top, tourism, training, transparency, transparent, Travel & Tourism Organizations News, Travelwire News, Trends, tried, ultra, unique, up, use, value, vegan, view, waste, way, We, wellness, were, white, WHO, work, working, works, World News, worried

PATA: Indian tourism to Asia Pacific will increase by 5.4 million in next 4 years

March 25, 2019 by Forimmediaterelease

India is set to generate an incremental increase of 5.4 million visitor arrivals between 2018 and 2023, according to a latest report by PATA’s Asia Pacific Visitor Forecasts 2019-2023.

Of the 210 million additional foreign arrivals into Asia Pacific generated between 2018 and 2023, 73.7 percent will come from Asian origin markets.

The strongest Asian generators of additional visitor arrivals between 2018 and 2023 will be led by China and Hong Kong SAR with respective increases of 49.2 million and 30.8 million. These markets will be supported by Korea (ROK), Malaysia and India. The Asian Average Annual Growth Rate for tourism receipts between 2018 and 2023 is expected to be around 9.1 per cent, with Northeast and Southeast Asia showing even stronger average growth.

“The growth momentum of Asia Pacific as both a receiver and a generator of international visitors – not just into Asia Pacific but globally – and the receipts that they both receive and generate, is set to continue to at least 2023,” said Dr Mario Hardy, CEO, PATA. “As is always the case, growth in international arrivals across Asia Pacific and indeed globally, is often unequal, with subtle changes and shifts occurring as travellers tune into new experiences and the destinations that offer them,” he said.

Travel News | eTurboNews

Share this:

  • Twitter
  • Facebook

Filed Under: Press Release Tagged With: and, annual, arrivals, Asia, Asia Pacific, Asian, average, Breaking Travel News, case, CEO, changes, China, come, continue, Destinations, Dr, even, expected, experiences, forecasts, foreign, foreign arrivals, free, generator, generators, globally, Growth, Growth Rate, Hong, Hong Kong, Hospitality News, in, increase, increases, India, India Travel News, Indian, Indian tourism, International, international arrivals, International Travel News, international visitors, just, Kong, Korea, LATEST, LED, Malaysia, markets, million, million visitor, momentum, New, News articles, northeast, offer, Pacific, PATA, percent, rate, receipts, receive, report, s, said, SAR, Southeast, Southeast Asia, stronger, to, TO BE, tourism, tourism receipts, Travel & Tourism Organizations News, Travel Destination News, travellers, Travelwire News, visitor, visitor arrivals, visitors, World News, years

Tourism Linkages Speed Networking event yields over $630 million in contracts for local entrepreneurs

March 21, 2019 by Forimmediaterelease

Jamaica Tourism Minister, Hon. Edmund Bartlett yesterday revealed that his Ministry’s Tourism Linkages Speed Networking event has resulted in local Small and Medium Tourism Enterprises (SMTEs) negotiating contracts valued at over $630 million, over the past three years.

Speaking at this year’s staging of the Speed Networking event in Montego Bay, the Minister said, “I am pleased to share that Speed Networking 2016 resulted in contracts valued at some $181 million; while the 2017 event saw suppliers benefitting from over $200 million in contracts; and in 2018, the value of these contracts grew to over $250 million. That is over $630 million in contacts for local SMTEs from just three one-day linkages events.”

He also noted that among the top beneficiaries of the event, were Boss Furniture and Tortuga Rum Cakes.

Boss Furniture won a contract valued at $30 million to provide bedding and furnishings to Montego Bay’s new S Hotel while another $10 million in contracts with that property is in the pipeline.

In addition, Boss Furniture CEO Omar Azan is also in negotiation with the Sandals and Hendrickson Groups to supply their properties with locally made bedding and furniture. Tortuga Rum Cakes also negotiated a $500,000 contract with Half Moon Hotel, from their participation in the event.

Tourism Minister, Hon. Edmund Bartlett, (right) converses with (from left) Princess Hotels and Resorts’ Rafael Millán, President of the Jamaica Manufacturers and Exporters’ Association (JMEA), Metry Seaga, and Director of the Tourism Linkages Network, Carolyn McDonald-Riley at the fifth staging of the Tourism Linkages Speed Networking event.
Princess Hotels and Resorts, ranked eighth in the Spanish market has 19 hotels. They will construct 2000 new rooms in Hanover, to the tune of some USD500Million. The business-to-business initiative took place on March 20, 2019 at the Montego Bay Convention Centre.

“This event is a tremendous help to local manufacturers, farmers and service providers. In creating these linkages, it helps us to grow our business, provide jobs for our people, provide revenue for the government, and in the end grow our economies. Two years ago, I attended the event and got a big order from a hotelier and it can be like that for any supplier,” said Mr Azan.

The Minister noted that the event is a key initiative designed to offer support to SMTEs and helps to strengthen the linkages between tourism and other sectors of the economy, and in so doing, increases the economic impact of the sector.

“The strategy must be to increase the capacity to supply the demands that tourism consumption patterns require and find creative ways of building entrepreneurship among our local stakeholders to fill these requirements. In this way, we will retain more of the revenue generated by tourism in the local economy and stop leakages,” he said.

The Tourism Linkages Speed Networking event took place on March 20 at the Montego Bay Convention Centre. It is a core initiative of the Tourism Linkages Network in close collaboration with the Jamaica Hotel and Tourist Association (JHTA), Jamaica Manufacturers’ Exporters’ Association (JMEA), Jamaica Promotions Corporation (JAMPRO), Rural Agricultural Development Authority (RADA) and the Jamaica Business Development Corporation (JBDC).

The event format features fifteen minute pre-scheduled meeting appointments between Managing Directors, General Managers or CEOs of local supplier companies of products and services with Owners or Managers of properties, restaurants, attractions and other tourism entities throughout the course of one day.

Additional representatives from core areas within the hotel’s operation such as Purchasing, Food and Beverage and Maintenance who are in a position to make purchasing decisions also attend.

For this year’s staging organizers targeted suppliers from areas such as: Digital marketing, Content capture services, Maintenance providers and Entertainment. Other suppliers included areas such as furniture, fresh produce, craft, chemicals and cleaning products, cosmetics and spa products, training, electrical services and construction.

“Last year we had 56 supplier companies and 33 tourism entities in attendance. This year we have 110 supplier companies and 57 tourism entities, proof that this event is gaining traction because participants are seeing results,” said the Minister.

Travel News | eTurboNews

Share this:

  • Twitter
  • Facebook

Filed Under: Press Release Tagged With: and, appointments, areas, association, attend, attendance, attractions, authority, Bartlett, Bay, beverage, big, boss, Breaking Travel News, building, Business, Business Development, capacity, caption, Centre, CEO, CEOs, cleaning, close, collaboration, companies, construction, consumption, contacts, Content, contract, contracts, convention, Convention Centre, Corporation, course, craft, creative, day, decisions, demands, designed, development, digital, Digital Marketing, director, directors, doing, economic, economic impact, economies, Economy, Edmund Bartlett, end, entertainment, entrepreneurs, entrepreneurship, event, Events, farmers, Features,, find, food, Fresh, furniture, general, Got, government, groups, grow, half, Half Moon, help, helps, Hon, hotel, Hotel and Tourist Association, hotelier, Hotels, hotels and resorts, ID, impact, in, included, increase, increases, initiative, IT, Jamaica, Jamaica Hotel, Jamaica Hotel and Tourist Association, Jamaica tourism, Jamaica Tourism Minister, Jamaica travel news, Jobs, just, last, like, linkages, linkages events, local, locally, maintenance, Make, managers, Managing, Manufacturers, march, Market, Marketing, Medium, Medium Tourism, meeting, MICE Industry News, million, minister, Minister said, ministry, Montego, Montego Bay, Moon, Mr, network, networking, networking event, New, News articles, offer, Omar, operation, order, over, owners, participants, participation, past, People, pipeline, Place, position, Pre, president, Princess, products, promotions, properties, property, purchasing, RADA, ranked, require, requirements, resorts, restaurants, resulted, results, revealed, Revenue, right, rooms, rum, rural, s, said, sandals, scheduled, sector, sectors, seeing, service, service providers, services, Share, small, spa, Spanish, Speed Networking, staging, stakeholders, stop, strategy, supplier, suppliers, supply, support, The Minister, to, top, tourism, tourism enterprises, Tourism Linkages Speed Networking, tourism minister, tourist, Tourist Association, training, Travel & Tourism Organizations News, Travel Destination News, Travelwire News, US, value, way, ways, We, were, WHO, won, year, years, yesterday, yields

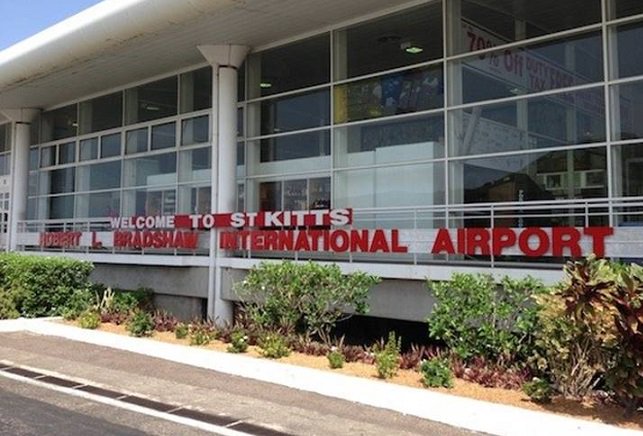
St. Kitts & Nevis records double-digit growth for first two months of 2019

March 21, 2019 by Forimmediaterelease

Demand for St. Kitts & Nevis as a premier destination for travelers continues to rise, with air arrivals for the first two months of this year posting a year-to-date increase of 15.3% system-wide as compared to the same period in 2018. Results are even better from North America, the destination’s largest source market, registering a year-to-date increase in air arrivals of 19.3% for January and February 2019 as compared to the same months in 2018. This continues the growth of airlift from major gateways in 2018, which increased over 2017 by 9.3% system-wide and reached a total of 153,364 air passenger arrivals for the full year, the highest number ever recorded in the destination’s history.

“I am extremely pleased to see such strong increases in air passenger arrivals to our Federation for 2018 continuing into peak season 2019,” said the Hon. Lindsay F.P. Grant, Minister of Tourism for St. Kitts & Nevis. “These numbers are a clear indication that we are gaining momentum towards reaching our goal of 150,000 stayover visitors in the next few years.”

“We redoubled our marketing efforts in the fourth quarter of last year specifically to support our additional peak season air service and these numbers demonstrate that we have achieved very successful results,” added Racquel Brown, CEO of the St. Kitts Tourism Authority. “With the milestone airlift arrivals recorded for 2018 and performance last year in the months of March and June nearing 30% growth over the same months in 2017, the significant growth measured so far in 2019 signals a rising demand for St. Kitts as a highly desirable travel destination, particularly from North America and for key events such as St. Kitts Music Festival. We will continue to employ this successful marketing formula as we strive to reach our goal of 150,000 stayover guests by 2021 from our primary source markets of the US, Canada, UK and the Caribbean.”

St. Kitts’ marketing strategy maintains a particular focus on reaching individuals who are a match with the geo-demographic lifestyle data of its target visitors in key gateway markets to support airlift year-round as well as marquee island events including St. Kitts Music Festival. In the fourth quarter of 2018, additional digital, print and spot TV advertising combined with public relations to communicate special offers and raise brand awareness in and around select North American cities comprised a coordinated campaign to grow arrivals for peak season 2018-2019. The Ministry of Tourism and the St. Kitts Tourism Authority also work closely with airlines to systematically build out air bridges to/from identified target gateways to grow service in a sustainable manner while making the island increasingly easy to reach via air.

St. Kitts & Nevis welcomed non-stop Saturday flights from Minneapolis that started December 22, 2018 and operate through April 20, 2019. In addition, from Newark Liberty International Airport in New Jersey, the destination receives Wednesday non-stop flights that started January 9, 2019 and operate through March 6, 2019 to complement existing non-stop Saturday flights. Looking ahead to the summer, new non-stop Saturday flights from Dallas starting May 25, 2019 and operating through August 17, 2019 open up a new gateway with easy connections from Houston and the western states of the US.

About St. Kitts:

Intoxicating natural beauty, sunny skies, warm waters, and sandy beaches combine to make St. Kitts one of the most seductive spots in the Caribbean. Located in the northern Leeward Islands, it offers a diverse tourism product developed from the destination’s natural beauty, cultural heritage and rich history. The island’s stunning variety of tourism attractions include hiking through the tropical rainforest, riding the scenic railway that connects the island’s former sugar plantations, visiting the Caribelle Batik factory, and touring Brimstone Hill Fortress National Park, which is an UNESCO World Heritage Site. Among the more traditional vacation pastimes available are water sports including catamaran cruises, golf, shopping, tennis, dining, gaming at St. Kitts’ exclusive casino or simply relaxing on the beach.

Travel News | eTurboNews

Share this:

  • Twitter
  • Facebook

Filed Under: Press Release Tagged With: and, April, arrivals, attractions, August, authority, Awareness, batik, beach, beaches, beauty, better, brand, brand awareness, Breaking Travel News, bridges, brown, build, campaign, Canada, Caribbean, casino, catamaran, CEO, cities, Clear, combine, compared, connections, continue, continues, Cruise ship news, cruises, cultural, cultural heritage, Dallas, Data, date, December, demand, Destination, digital, dining, double, efforts, even, Events, exclusive, existing, far, federation, Festival, first, flights, Formula, free, full, gaming, gateway, gateways, goal, golf, grant, grow, Growth, guests, heritage, highest, history, Hon, Hospitality News, Hotel Travel News, Houston, in, including, increase, increased, increases, International, International Airport, International Travel News, island, islands, IT, January, June, Kitts, Kitts Tourism, Kitts Tourism Authority, largest, last, Liberty International Airport, Lifestyle, looking, Make, march, Market, Marketing, markets, match, May, milestone, minister, Minister of Tourism, ministry, Ministry of Tourism, Minneapolis, momentum, months, most, music, Music Festival, national, national park, natural, Nevis, New, New Jersey, Newark, Newark Liberty International Airport, News articles, Non, non-stop, non-stop flights, North, North America, North American, Northern, number, numbers, offers, open, operate, Operating, out, over, park, passenger, passenger arrivals, peak, peak season, performance, period, premier, product, public, Public Relations, quarter, railway, rainforest, raise, record, recorded, records, relations, relaxing, Resort News, results, rich, rise, rising, Round, s, said, Saint Kitts and Nevis travel news, scenic, season, seductive, see, service, shopping, significant, significant growth, site, skies, Source, Special, special offers, sports, spots, St, St. Kitts, St. Kitts & Nevis, St. Kitts Tourism Authority, states, stop, strategy, strong, successful, summer, support, sustainable, system, target, tennis, the Caribbean, The Ministry, through, to, total, touring, tourism, tourism authority, tourism product, traditional, Transportation News, Travel, Travel & Tourism Organizations News, travel destination, Travel Destination News, travelers, Travelwire News, tropical, TV, TV advertising, UK, UNESCO, UNESCO world heritage, UNESCO world heritage site, up, US, vacation, variety, visiting, visitors, water, water sports, waters, We, welcomed, Western, WHO, work, World, World Heritage, World Heritage Site, World News, year, year-round, years

Brazil announces visa-free entry for US, Canadian, Australian, and Japanese citizens

March 19, 2019 by Forimmediaterelease

Brazil is open for you! The Brazilian Government announced that Brazil would allow visa-free entry for citizens of The United States, Canada, Australia, and Japan, effective in 90 days (June 17th). Until then, the current e-visa will be required.

Citizens of those countries wishing to visit Brazil will no longer need to apply or pay for a visa. They will be able to stay in Brazil for 90 days from the date of first entry in the country, extendable for an equal period, provided that it does not exceed one hundred and eighty days, every twelve months, counted from the date of the first entry into the Country.

These developments come as part of a series of measures that Brazil has taken to facilitate visitor access to the country. Last year, the government launched an e-visa platform through which travelers could apply for visas with more efficiency and ease.

Brazil has already seen extremely positive results with an increase of about 35% in the visa application in less than a year since implementing e-visa. These four countries are considered strategic for the development of tourism in Brazil.

According to the Foreign Ministry, in 2017, 169,910 visas (either for business, tourism or transit) had been issued to citizens of the four countries. With the implementation of e-visa, the number rose in 2018 to 229,767.

“This is one of the most important achievements of the Brazilian tourism industry in the last 15 years and we are confident that it will be extremely beneficial to the country,” said Marcelo Alvaro Antônio, Minister of Tourism. “This decision of the Brazilian government proves that we are living a new moment and that tourism is being seen as a vector of economic and social growth of the entire nation. This is the first step; we still have much to celebrate,” explained Minister Antônio.

“The United States was very receptive to the issuance of electronic visas. The World Tourism Organization says that when adopting an electronic visa, visa issuance increases by 25%, so we have exceeded that mark,” said Teté Bezerra, president of Embratur (Brazil’s Tourism Board, a federal agency and part of the Ministry of Tourism).

Now, with a strong Dollar and dozens of daily flights, experiencing Brazil is just a matter of desire and grabbing a plane. From the Amazon in the North to the wines in the South; from the exotic Pantanal in the Midwest to the lush beaches of the Northeast; amazing cities like Rio de Janeiro, São Paulo, Salvador and hundreds of hidden gems are just a few hours away.

Travel News | eTurboNews

Share this:

  • Twitter
  • Facebook

Filed Under: Press Release Tagged With: and, announced, announces, Application, apply, Australia, Australian, beaches, board, Brazil, Brazil travel news, Brazilian, Brazilian Government, Brazilian tourism, Breaking Travel News, Business, Canada, Canadian, celebrate, cities, citizens, come, counted, countries, country, countryrdquo, current, daily, daily flights, date, decision, development, developments, dollar, ease, economic, efficiency, electronic, EMBRATUR, entry, exotic, explained, Feature, federal, first, flights, foreign, free, government, Government Affairs, Growth, hidden, Hospitality News, hours, hundred, implementation, important, in, increase, increases, Industry, International Travel News, issued, IT, Janeiro, japan, Japanese, June, just, last, launched, less, like, Living, matter, measures, midwest, minister, Minister Ant, Minister of Tourism, ministry, Ministry of Tourism, months, most, nation, need, New, News articles, North, northeast, number, open, organization, pay, period, platform, positive, president, results, Rio, Rio de Janeiro, rose, s, said, Salvador, São, says, series, social, South, states, stay, strategic, strong, The Ministry, the United States, The World, through, to, tourism, tourism board, Tourism Industry, Travel Destination News, travelers, Travelwire News, United, United States, US, visa, visa-free, visafree, visas, visit, visitor, We, wines, World, World News, World Tourism, World Tourism Organization, year, years

Search


Recent Articles

  • Coronavirus Disease 2019 (COVID-19) situation in Thailand as of 18 April 2021, 11.30 Hrs.
  • The Unbound Collection by Hyatt Brand Expands in China With The Opening of Commune by The Great Wall
  • Coronavirus Disease 2019 (COVID-19) situation in Thailand as of 17 April 2021, 11.30 Hrs.
  • Thailand strengthens measures to contain new wave of COVID-19 infections
  • Aeroflot adds third frequency on Seychelles route
  • Spanish Ambassador to Jamaica pays courtesy call on Jamaica’s Tourism Minister
  • CAAT announces COVID-19 control guidelines on domestic flights
  • Coronavirus Disease 2019 (COVID-19) situation in Thailand as of 13 April 2021, 11.30 Hrs.
  • Royal Palaces temporarily close from 13 April 2021 until further notice
  • Coronavirus Disease 2019 (COVID-19) situation in Thailand as of 14 April 2021, 11.30 Hrs.

Copyright © 2021 · Metro Pro on Genesis Framework · WordPress · Log in