• Home
  • Post a press-release
  • Visibility packages
  • Subscribe email updates
  • Event Calendar
  • Contact

For Immediate Release | Official News Wire for the Travel Industry

Where press releases are breaking news

  • Home
  • Post a press-release
  • Visibility packages
  • Subscribe email updates
  • Event Calendar
  • Contact

Hawaii hotels: Flat average daily rate, lower occupancy so far in 2019

April 24, 2019 by Forimmediaterelease

For the first three months of 2019, Hawaii hotels statewide reported flat average daily rate (ADR) and lower occupancy, which resulted in lower revenue per available room (RevPAR) compared to the first quarter of 2018.

According to the Hawaii Hotel Performance Report published by the Hawaii Tourism Authority (HTA), statewide RevPAR declined to $236 (-3.3%), with ADR of $292 and occupancy of 80.8 percent (-2.7 percentage points) in the first quarter of 2019.

HTA’s Tourism Research Division issued the report’s findings utilizing data compiled by STR, Inc., which conducts the largest and most comprehensive survey of hotel properties in the Hawaiian Islands.

For the first quarter, Hawaii hotel room revenues fell by 4.7 percent to $1.13 billion compared to the $1.18 billion earned in the first quarter of 2018. There were more than 74,300 fewer available room nights (-1.5%) in the first quarter and approximately 190,500 fewer occupied room nights (-4.7%) compared to a year ago. Several hotel properties across the state were closed for renovation or had rooms out of service for renovation during the first quarter.

All classes of Hawaii hotel properties statewide reported RevPAR declines in the first quarter of 2019 except Upper Midscale Class properties ($134, +0.6%). Luxury Class properties reported RevPAR of $452 (-5.4%) with ADR of $594 (-1.2%) and occupancy of 76.1 percent (-3.3 percentage points). At the other end of the price scale, Midscale & Economy Class hotels reported RevPAR of $155 (-5.0%) with ADR of $187 (-0.5%) and occupancy of 83.1 percent (-3.9 percentage points).

Comparison to Top U.S. Markets

In comparison to top U.S. markets, the Hawaiian Islands earned the highest RevPAR at $236 in the first quarter, followed by the San Francisco/San Mateo market at $210 (+15.9%) and the Miami/Hialeah market at $208 (-3.5%). Hawaii also led the U.S. markets in ADR at $292 followed by San Francisco/San Mateo and Miami/Hialeah. The Hawaiian Islands ranked fifth for occupancy at 80.8 percent, with Miami/Hialeah topping the list at 83.0 percent (-2.1 percentage points).

Hotel Results for Hawaii’s Four Counties

Hotel properties in Hawaii’s four island counties all reported RevPAR decreases in the first quarter of 2019. Maui County hotels led the state overall in RevPAR at $337 (-2.7%), with ADR at $428 (-0.9%) and occupancy at 78.6 percent (-1.5 percentage points).

Kauai hotels earned RevPAR of $228 (-10.2%), with flat ADR at $305 (+0.2%) and lower occupancy of 74.8 percent (-8.7 percentage points).

Hotels on the island of Hawaii reported a decline in RevPAR to $225 (-9.7%), due to a combination of decreases in both ADR ($285, -2.0%) and occupancy (79.1%, -6.7 percentage points).

Oahu hotels earned slightly lower RevPAR at $196 (-0.9%), with ADR at $236 (+0.8%) and occupancy of 83.0 percent (-1.4 percentage points).

Comparison to International Markets

When compared to international “sun and sea” destinations, Hawaii’s counties were in the middle of the pack for RevPAR in the first quarter of 2019. Hotels in the Maldives ranked highest in RevPAR at $575 (+4.5%) followed by Aruba at $351 (+11.2%). Maui County ranked third, with Kauai, the island of Hawaii, and Oahu ranking sixth, seventh and eighth, respectively.

The Maldives also led in ADR at $737 (+5.2%) in the first quarter, followed by French Polynesia at $497 (-1.1%). Maui County ranked fifth, followed by Kauai and the island of Hawaii. Oahu ranked ninth .

Oahu trailed Phuket (84.5%, -6.3 percentage points) in occupancy for sun and sea destinations in the first quarter. The island of Hawaii, Maui County and Kauai ranked fourth, fifth and ninth, respectively.

March 2019 Hotel Performance

In March 2019, RevPAR for Hawaii hotels statewide declined to $227 (-4.3%), with ADR of $285 (-1.1%) and occupancy of 79.6 percent (-2.7 percentage points).

In March, Hawaii hotel room revenues fell by 5.9 percent to $373.3 million. There were more than 27,200 fewer available room nights (-1.6%) in March and approximately 66,850 fewer occupied room nights (-4.9%) compared to a year ago. Several hotel properties across the state were closed for renovation or had rooms out of service for renovation during March. However, the number of rooms out of service may be under-reported.

All classes of Hawaii hotel properties statewide reported RevPAR declines in March. Luxury Class properties reported RevPAR of $443 (-7.2%) with ADR of $583 (-3.1%) and occupancy of 75.9 percent (-3.4 percentage points). Midscale & Economy Class hotels reported RevPAR of $150 (-2.9%) with ADR of $182 (+0.8%) and occupancy of 82.0 percent (-3.1 percentage points).

Hotel properties in Hawaii’s four island counties all reported lower RevPAR for March. Maui County hotels reported the highest RevPAR in March at $336 (-1.4%) with ADR of $421 (-1.6%) and flat occupancy (79.8%, +0.2 percentage points).

Oahu hotels reported lower occupancy (80.4%, -2.3 percentage points) and flat ADR ($230, -0.2%) for March.

Hotels on the island of Hawaii continued to face challenges in March, with RevPAR dropping 11.2 percent to $216, ADR to $272 (-4.9%) and occupancy to 79.2 percent (-5.7 percentage points).

RevPAR for Kauai hotels fell to $213 (-14.6%) in March, with declines in both ADR to $286 (-4.5%) and occupancy to 74.4 percent (-8.8 percentage points).

Travel News | eTurboNews

Share this:

  • Twitter
  • Facebook

Filed Under: Press Release Tagged With: American Travel News, and, Aruba, authority, average, billion, Breaking Travel News, challenges, class, Class hotels, classes, closed, compared, continued, Corporate News, County, daily, Data, decline, declined, declines, Destinations, Division, due, Economy, economy class, end, face, far, Feature, fewer, findings, first, first quarter, flat, followed, Francisco, free, French, French Polynesia, Hawaii, Hawaii Hotel Performance Report, Hawaii tourism, Hawaii Tourism Authority, Hawaii Travel News, Hawaiian, hawaiian islands, highest, Hospitality News, hotel, hotel room, Hotel Travel News, Hotels, HTA, in, Inc, International, international markets, island, islands, issued, Kauai, largest, LED, list, lower, Luxury, Luxury Travel News, maldives, march, Market, markets, Maui, May, Miami, Middle, million, months, most, News articles, nights, number, Oahu, occupancy, out, pack, percent, percentage, performance, Phuket, points, Polynesia, price, properties, published, quarter, ranked, ranking, rate, renovation, report, reported, research, Resort News, resulted, results, Revenue, revenue per available room, revenues, REVPar, room, room nights, rooms, s, San Francisco, scale, sea, service, Slightly, State, STR, Sun, survey, The Island, to, top, tourism, tourism authority, tourism research, Travel & Tourism Organizations News, Travel Destination News, Travelwire News, were, year

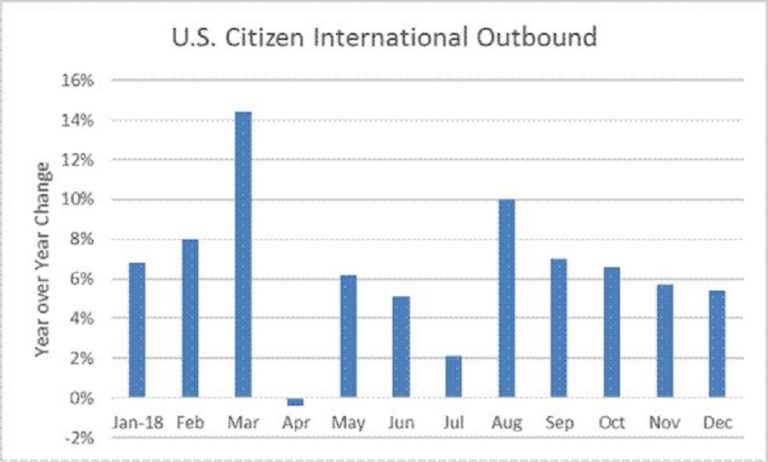
US citizen international departures up 6% in 2018

April 4, 2019 by Forimmediaterelease

U.S. air travel to overseas markets totaled 41.8 million, up nine percent for the year. Regional results were:

  • Europe, 17.7 million travelers, up 12 percent
  • Caribbean, 8.3 million travelers, up five percent
  • Asia, 6.3 million travelers, up eight percent
  • Central America, 3.2 million travelers, up seven percent
  • Middle East, 2.4 million travelers, up six percent
  • South America, 2.1 million travelers, up nine percent
  • Oceania, 861,000 travelers, up 11 percent
  • Africa, 432,000 travelers, up seven percent

U.S. travel to North American markets totaled 51.3 million, up four percent compared to 2017.

  • To Mexico, U.S. travelers totaled a record 36.9 million, up six percent
  • ‘Tourist’ (longer haul travel) 19.1 million, up four percent.
  • U.S. air travel to Mexico (10.1 million), part of ‘Tourist’, was up three percent
  • Border (1+ nights travel) 17.8 million, increased eight percent.
  • To Canada, 14.3 million U.S. travelers, ‘flat’ year-over-year. Air travel (4.6 million) was down four percent

Annual 2018 Market Shares

U.S. air travel to overseas locations accounted for 45 percent of total U.S. outbound travel, up one percentage point from 2017. Regional composition:

    • Europe, a 19 percent share (up one percentage point from 2017);
    • Caribbean, a nine percent share; (down one percentage point from 2017)
    • Asia, a seven percent share;
    • Central America, a four percent share;
    • Middle East, a three percent share;
    • South America, a two percent share);
    • Oceania, a one percent share, and
    • Africa, almost a one percent share

North American markets received 55 percent of all U.S. international outbound travel.

    • U.S. travel to Mexico a 40 percent share;
    • To Canada, a 15 percent share (down one percentage point from 2017).

For detailed information and data tables please click here.

Canada and Mexico numbers are preliminary. The chart will reflect final changes.

In 2011, NTTO (then OTTI) began to report U.S. outbound travel monthly by all modes, expanding beyond air-only traffic. Total travel, inclusive of all modes, to Canada and Mexico is reported in addition to the air-only subtotals. The timing of this report is dependent data from the U.S. Department of Homeland Security, Stats Canada and Banco de Mexico (INEGI), respectively.

Travel News | eTurboNews

Share this:

  • Twitter
  • Facebook

Filed Under: Press Release Tagged With: and, annual, Asia, Aviation News, border, Breaking Travel News, Canada, Caribbean, Central, Central America, changes, citizen, Click, compared, Data, department, Department of Homeland Security, departures, down, East, eight, Europe, expanding, flat, Homeland Security, in, inclusive, increased, information, International, international departures, International Travel News, locations, Market, markets, Mexico, Middle, Middle East, million, million travelers, million U.S., News articles, nights, North, North American, numbers, only, outbound, outbound travel, over, overseas, percent, percentage, received, record, regional, report, reported, results, s, Security, seven, Share, shares, South, South America, timing, to, total, tourist, traffic, Transportation News, Travel, Travel & Tourism Organizations News, Travel Destination News, travelers, Travelwire News, U.S, U.S. travel, U.S. travelers, up, US, US citizen, were, year

Nonstop between Washington Dulles and Acrra, Ghana grows on SAA

April 3, 2019 by Forimmediaterelease

Starting today, South African Airways (SAA) has increased its frequency on nonstop flights between Washington, D.C.-Dulles International Airport and Accra’s Kotoka International Airport to 5 days weekly.

SAA offers the only nonstop flight between Washington D.C. and Ghana and offers travelers convenient connections to and from over 100 cities across the U.S. and Canada through its Star Alliance partner, United Airlines via Washington, D.C.- Dulles.

South African Airways’ flights to Accra now operate 5 days a week with continuing service to Johannesburg, South Africa, operating on Monday, Tuesday, Wednesday, Thursday, and Saturday. SAA’s increase of flights on the route will also serve to support the partnership with Africa World Airlines by offering seamless connections between Accra and additional destinations in West Africa including; Lagos and Abuja, Nigeria; Monrovia, Liberia and Freetown, Sierra Leone. In addition, SAA will continue to operate flights between Washington D.C.-Dulles and Dakar, Senegal and onwards to Johannesburg, two days per week.

SAA’s flights between Washington-Dulles and Accra will be operated with both the Airbus A330-300 and the Airbus A330-200 aircraft. The A330-300 features 46 full-flat 180° beds with direct aisle access at every seat in Premium Business Class and 203 seats in Economy Class. The A330- 200 offers 36 full-flat beds in Premium Business Class and 186 seats in Economy Class. Customers traveling in both Premium Business Class and Economy Class will have on-demand audio and visual entertainment options, in-seat power ports, freshly-prepared meals, and complimentary bar service featuring South African wines.

For information, visit flysaa.com.

Travel News | eTurboNews

Share this:

  • Twitter
  • Facebook

Filed Under: Press Release Tagged With: and, Audio, Aviation News, aviation-website, bar, beds, Breaking Travel News, Business, business class, c, Canada, cities, class, complimentary, connections, continue, convenient, customers, D.C., Days, demand, Destinations, direct, Dulles, Economy, economy class, entertainment, Features,, featuring, flat, flight, flights, freetown, frequency, full, Ghana, Ghana travel news, in, including, increase, increased, information, International, International Airport, Johannesburg, kotoka international, Lagos, Liberia, meals, Monrovia, News articles, Nigeria, nonstop, nonstop flight, nonstop flights, offering, offers, only, operate, operated, Operating, options, over, partner, partnership, ports, power, premium, Premium Business Class, route, s, SAA, seamless, seat, seats, Senegal, serve, service, Sierra Leone, South, South Africa, south african, South African Airways, Star, Star Alliance, support, through, to, today, Transportation News, Travel Destination News, travelers, traveling, Travelwire News, two days, U.S, United, United Airlines, visit, Washington, Washington D.C., Washington Dulles, week, weekly, West, West Africa, wines, World

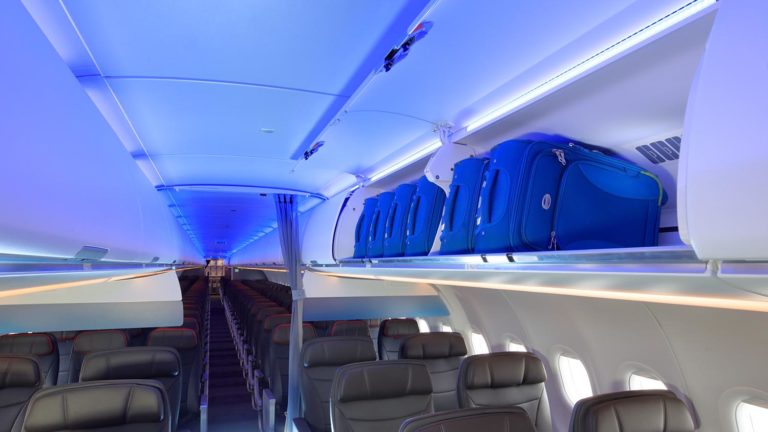
American Airlines: New cabin, larger overhead luggage bins

April 2, 2019 by Forimmediaterelease

American Airlines is starting scheduled flights with the first of its 100 new Airbus A321neo aircraft on order. These aircraft come equipped with an all-new cabin interior designed for enhanced passenger comfort and convenience, including larger Airspace XL overhead luggage bins that increase carry-on bag capacity.

American is the launch customer for the Airspace XL bins, which provide approximately 40 percent more overhead storage space for passengers on board the 196-seat aircraft. In addition to equipping its new A321neos with the XL bins, American also plans to retrofit its entire in-service fleet of earlier A321 models – more than 200 aircraft – with the cabin features included on the new A321neos.

Ingo Wuggetzer, Airbus’ Vice President of Cabin Marketing said: “We are very pleased that American Airlines’ first A321neos with the Airspace XL bins are now entering service. We constantly work with airline customers to improve our aircraft cabins, and American in particular played an instrumental role with us in developing our biggest and best overhead bins to date.”

The Airspace XL bins accommodate larger luggage – up 24” x 16” x 10” – allowing standard roll-on bags to be loaded on their sides instead of being inserted flat. This creates room for up to four bags in each bin instead of the current three. The larger bins will significantly reduce the number of passenger bags checked at the gate, and sent to the cargo hold.

American‘s selected cabin layout allows the airline greater flexibility in seating arrangements and use of cabin space. The two class cabin will gain an additional row of first-class seats, bringing the total to 20. Outfitting the A321neo with a free wireless inflight-entertainment (IFE) system allows passengers to select a wide-range of options from their own devices. LED mood lighting will enhance the cabin environment.

Powered by CFM LEAP-1A engines and ETOPS certified for lengthy over water flights, the A321neo will allow American to carry larger loads on its longer, more densely travelled routes such as Los Angeles and Phoenix to Orlando, or West Coast hubs to Hawaii.


The A321neo is the largest member of the A320 Family, seating up to 240 passengers, depending on cabin configuration. Incorporating the latest engines, aerodynamic advances, and cabin innovations, the A321neo offers a reduction in fuel consumption of at least 15 percent per seat from day

Travel News | eTurboNews

Share this:

  • Twitter
  • Facebook

Filed Under: Press Release Tagged With: and, Aneos, Angeles, arrangements, Aviation News, aviation-website, bag, bags, best, biggest, bins, bins American, board, Breaking Travel News, bringing, cabin, cabins, capacity, cargo, cargo hold, carry-on, certified, class, coast, come, comfort, consumption, Corporate News, current, customer, customers, date, day, designed, devices, earlier, engines, entertainment, environment, ETOPS, Family, Features,, first, flat, fleet, flights, free, fuel, fuel consumption, Gate, greater, Hawaii, hubs, improve, in, included, including, increase, inflight, innovations, Instead, interior, largest, LATEST, launch, LED, Los Angeles, luggage, Marketing, member, nbsp, New, News articles, number, offers, on board, options, order, Orlando, over, overhead bin, overhead bins, passenger, passengers, percent, Phoenix, plans, powered, president, range, reduce, reduction, Retrofit, role, room, routes, row, s, said, scheduled, scheduled flights, seat, seating, seats, selected, service, significantly, space, standard, Storage, system, to, TO BE, total, tourism, Transportation News, Travel Destination News, travelled, Travelwire News, up, US, use, vice president, water, We, West, West Coast, wireless, work, x, XL, XL bins, XL overhead

Number of Hawaii visitors up but spending down

March 28, 2019 by Forimmediaterelease

Visitors to the Hawaiian Islands spent a total of $1.39 billion in February 2019, a decrease of 2.7 percent compared to February 20181, according to preliminary statistics released today by the Hawaii Tourism Authority. This is another dip following the 3.8 decrease in January.

In February, visitor spending increased from the U.S. West (+4.7% to $503.3 million) but declined from U.S. East (-6.7% to $370.9 million), Japan (-0.8% to $170.1 million), Canada (-0.7% to $150.7 million) and All Other International Markets (-15.3% to $188.7 million) compared to a year ago.

On a statewide level, average daily visitor spending was down slightly (-0.9% to $200 per person) in February year-over-year. Visitors from Japan (+3.3%), U.S. West (+1.2%) and All Other International Markets (+0.7%) spent more per day while visitors from U.S. East (-4.1%) and Canada (-1.0%) spent less.

A total of 782,584 visitors (+0.5%) came to Hawaii in February 2019, up slightly from the same month last year. Arrivals by air service (+0.3% to 766,293) were comparable to last February while arrivals by cruise ships (+12.1% to 16,291) increased. However, total visitor days2 declined (-1.9%) versus February 2018 due to a shorter average length of stay by visitors from most markets.

The average daily census3 of total visitors in the Hawaiian Islands on any given day in February was 248,244, down 1.9 percent compared to February last year. Arrivals by air service realized growth from U.S. West (+6.5%), Canada (+2.5%) and Japan (+1.1%) which offset decreases from U.S. East (-0.9%) and All Other International Markets (-17.2%).

Visitor spending on Oahu decreased (-1.6% to $613.0 million) while visitor arrivals (456,820) were flat compared to last February. Maui recorded increases in both visitor spending (+1.2% to $413.0 million) and visitor arrivals (+1.5% to 220,801). The island of Hawaii saw declines in visitor spending (-17.5% to $192.3 million) and visitor arrivals (-14.8% to 137,502). Visitor spending increased on Kauai (+4.7% to $153.5 million) while visitor arrivals were similar (+0.2% to 104,167) to February 2018.

A total of 1,010,961 trans-Pacific air seats serviced the Hawaiian Islands in February, up slightly (+0.5%) from a year ago. Growth in air seats from Canada (+10.9%), Japan (+6.3%), Oceania (+1.8%), U.S. West (+0.5%) and U.S. East (+0.5%) offset declines from Other Asia Markets (-25.1%).

Year-to-Date 2019

Through the first two months of 2019, visitor spending declined (-2.4% to $3.01 billion) compared to the same period last year. Visitor arrivals increased (+1.8% to 1,603,205) but a shorter length of stay (-1.8% to 9.43 days) resulted in no growth in visitor days. Average daily spending (-2.4% to $199 per person) was lower compared to a year ago.

Visitor spending decreased from U.S. West (-0.8% to $1.06 billion), U.S. East (-1.8% to $832.5 million), Japan (-3.8% to $349.6 million), Canada (-0.4% to $318.3 million) and All Other International markets (-7.5% to $443.2 million).

Visitor arrivals increased from U.S. West (+5.5% to 631,064), U.S. East (+0.7% to 356,943), Japan (+3.3% to 251,488) and Canada (+0.7% to 133,915), but declined from All Other International Markets (-7.9% to 201,981).

Other Highlights:

U.S. West: Visitor arrivals from the Pacific region rose 7.6 percent in February compared to the previous year, with more visitors from Alaska (+13.7%), California (+8.4%), Washington (+6.7%) and Oregon (+2.9%). Arrivals from the Mountain region were up 3.2 percent in February with growth from Arizona (+9.5%) and Nevada (+8.5%), offsetting declines from Utah (-5.7%) and Colorado (-1.3%). Through the first two months, arrivals from the Pacific (+7.4%) and Mountain (+1.8%) regions increased versus the same period last year.

Through February 2019, average daily visitor spending dropped to $182 per person (-2.4%) compared to the same period last year, largely due to decreases in transportation and food and beverage expenses.

U.S. East: Growth in February visitor arrivals from the East South Central (+1.6%) and East North Central (+0.6%) regions were offset by decreases from the West South Central (-4.1%), South Atlantic (-4.0%), New England (-2.4%) and Mid Atlantic (-0.7%) regions compared to a year ago. For the first two months of 2019, arrivals were up from the East South Central (+7.2%), West North Central (+2.6%) and South Atlantic (+0.7%) regions.

For the first two months of 2019, average daily visitor spending declined to $214 per person (-1.4%), largely due to a decline in transportation expenses.

Japan: In February, more visitors stayed in hotels (+5.2%) while stays in condominiums (-16.1%) and timeshares (-7.6%) decreased compared to a year ago.

For the first two months of 2019, average daily visitor spending declined to $238 per person (-4.4%), primarily due to lower lodging and transportation expenses.

Canada: In February, less visitors stayed in condominiums (-7.3%) and hotels (-1.6%). Stays in rental homes (+23.7%) and timeshares (+4.4%) increased from a year ago.

For the first two months of 2019, average daily visitor spending decreased (–0.7% to $177 per person) compared to the same period last year, due to lower shopping as well as entertainment and recreation expenses.

MCI: A total of 57,043 visitors came to the Hawaiian Islands for meetings, conventions and incentives (MCI) in February, an increase of 10.4 percent from last year. More visitors came to attend conventions (+18.6%) and corporate meetings (+2.2%) but fewer traveled on incentive trips (-1.0%). Contributing to the growth in convention visitors was the 2019 International Stroke Conference, held at the Hawaii Convention Center, which brought nearly 6,000 delegates. Through the first two months, total MCI visitors grew (+10.5% to 116,310) compared to the same period last year.

Travel News | eTurboNews

Share this:

  • Twitter
  • Facebook

Filed Under: Press Release Tagged With: and, Arizona, arrivals, Asia, Atlantic, attend, authority, average, beverage, billion, Breaking Travel News, California, Canada, center, Central, Colorado, compared, conference, contributing, convention, Convention Center, conventions, corporate, corporate meetings, Cruise ships, Cruise,, daily, date, day, Days, decline, declined, declines, decrease, decreased, delegates, dip, down, due, East, England, entertainment, expenses, fewer, first, flat, following, food, Growth, Hawaii, Hawaii Convention Center, Hawaii tourism, Hawaii Tourism Authority, Hawaii Travel News, hawaii visitors, Hawaiian, hawaiian islands, held, HITA, homes, Hotels, in, In February, Incentive, incentives, increase, increased, increases, International, international markets, island, islands, January, japan, Kauai, last, length of stay, less, lodging, lower, markets, Maui, mci, MCI visitors, meetings, million, month, months, most, mountain, nearly, Nevada, New, New England, News articles, North, number, Oahu, offset, Oregon, over, Pacific, percent, period, recorded, recreation, region, regions, released, rental, resulted, rose, s, seats, service, ships, shopping, shorter, South, spending, statistics, stay, stays, The Island, through, timeshares, to, today, total, tourism, tourism authority, Trans, trans-Pacific, Transportation, Travel & Tourism Organizations News, Travel Destination News, traveled, Travelwire News, trips, up, Utah, visitor, visitor arrivals, visitor spending, visitors, Washington, were, West, year

  • 1
  • 2
  • Next Page »

Search


Recent Articles

  • Kingston Cops Award for Best Creative Destination for 2023
  • Jamaica Tourist Board Announces Retirement of Donnie Dawson
  • Curacao is Calling with Enticing Escapes
  • Frankfurt Airport: 2023 Summer Flight Schedule with New Destinations and Increased Seating Capacities
  • Minister Bartlett Welcomes Resurgence of Villas Sub-Sector
  • Tourism Seychelles Principal Secretary shares industry successes at 10th Arab Aviation Summit
  • Speed Networking Events Generate Over $650 Million in Revenue for Small Businesses Supplying Tourism Sector, says Bartlett
  • Enjoying the Suite Life at Sandals Resorts
  • Farmers Reap $108 Million in Revenue in first Two Months of 2023 through Revolutionary ALEX Platform
  • SAUDIA Signs an Agreement with Boeing to Order 49 Boeing 787 Dreamliners

Subscribe to daily email update

RSS eTN Articles

  • Qantas’ Jetstar Repeatedly Mistreats Disabled Passenger
  • Kingston Cops Award for Best Creative Destination for 2023
  • New Chicago, Dallas, JFK, LAX and Seattle Flights on Finnair
  • First Airbus A321neo Built in China Delivered to Juneyao Air
  • Spirits Fuel the Economy
  • Jamaica Tourist Board Announces Retirement of Donnie Dawson
  • Tanzania Committed to Saving Mount Kilimanjaro Glaciers
  • JetBlue Adds More Grenada Flights for Spicemas
  • Avoid travel to, from, or through Germany Sunday to Tuesday
  • HalalBooking and Turkish Airlines Renew Partnership

Archives

  • March 2023
  • February 2023
  • January 2023
  • December 2022
  • November 2022
  • October 2022
  • September 2022
  • August 2022
  • July 2022
  • June 2022
  • May 2022
  • April 2022
  • March 2022
  • February 2022
  • January 2022
  • December 2021
  • November 2021
  • October 2021
  • September 2021
  • August 2021
  • July 2021
  • June 2021
  • May 2021
  • April 2021
  • March 2021
  • February 2021
  • January 2021
  • December 2020
  • November 2020
  • October 2020
  • September 2020
  • August 2020
  • July 2020
  • June 2020
  • May 2020
  • April 2020
  • March 2020
  • February 2020
  • January 2020
  • December 2019
  • November 2019
  • October 2019
  • September 2019
  • August 2019
  • July 2019
  • June 2019
  • May 2019
  • April 2019
  • March 2019
  • February 2019
  • January 2019
  • December 2018
  • November 2018
  • October 2018
  • September 2018
  • August 2018
  • July 2018
  • June 2018
  • May 2018
  • April 2018
  • March 2018
  • February 2018
  • January 2018
  • December 2017
  • November 2017
  • October 2017
  • September 2017
  • August 2017
  • July 2017
  • June 2017
  • May 2017
  • April 2017
  • November 2016
  • October 2016
  • August 2016

Content

and Breaking Travel News Business CEO experience first free hotel Hotels in including Industry International International Travel News IT minister most New News articles only over People s said sandals The World through time to TO BE tourism Tours Transportation News Travel Travel & Tourism Organizations News Travel Destination News Travelwire News up We were WHO World World News year years

Copyright © 2023 · Metro Pro on Genesis Framework · WordPress · Log in